 | 16 Dec 2019
Solar-powered bus route: introducing renewable energy into a university campus transport system
Romanos Ioannidis
Theano Iliopoulou
Christina Iliopoulou
Loukas Katikas
Angeliki Petsou
Maria-Eleni Merakou
Maria-Eirini Asimomiti
Nikolaos Pelekanos
Giannis Koudouris
Panayiotis Dimitriadis
Christina Plati
Eleni I. Vlahogianni
Konstantinos Kepaptsoglou
Nikos Mamassis
Demetris Koutsoyannis
We investigate the application of a solar-powered bus route to a small-scale transportation system, as such of a university campus. In particular, we explore the prospect of replacing conventional fossil fuel buses by electric buses powered by solar energy and electricity provided by the central grid. To this end, we employ GIS mapping technology to estimate the solar radiation at the university campus and, accordingly, we investigate three different scenarios for harnessing the available solar power: (1) solar panels installed on the roof of bus stop shelters, (2) solar panels installed at an unused open space in the university, and (3) solar roads, i.e. roads constructed by photovoltaic (PV) materials. For each of the three scenarios, we investigate the optimal technical configuration, the resulting energy generation, as well as the capital cost for application in the case of NTUA campus in Athens (Greece). The preliminary feasibility analysis showcases that all three scenarios contribute to satisfying transportation demand, proportionately to their size, with scenario (2) presenting the lowest capital cost in relation to energy generation. Therefore, we further explore this scenario by simulating its daily operation including the actions of buying and selling energy to the central grid, when there is energy deficit or surplus, respectively. A sensitivity analysis is carried out in order to ascertain the optimal size of the solar panel installation in relation to profit and reliability. Overall, results indicate that, albeit the high capital costs, solar-powered transportation schemes present a viable alternative for replacing conventional buses at the studied location, especially considering conventional PV panels. We note that present results heavily depend on the choice of capacity factors of PV materials, which differ among technologies. Yet, as capacity factors of PV panels are currently increasing, the studied schemes might be more promising in the future.


Renewable energy sources have been at the core of efforts towards sustainability. In the past few years, a growing number of projects have been implemented in order to exploit solar energy at large university campuses for meeting building energy needs (Hasapis et al., 2017). Along the same lines, electric buses have been deployed in a number of cases to reduce the carbon footprint of on-campus transportation at large university campuses (Jang, 2018). Evidently, solar energy utilization for small scale transportation systems is yet at a preliminary stage. Even though several patents (Durham, 2006; Brusaw and Brusaw, 2018) and studies on pilot configurations (Duarte and Ferreira, 2016) can be found in literature, analyses of implementation of such configurations are still scarce. The exclusive use of solar panels to support the operation of campus bus routes has not been thoroughly investigated, while the exploitation of solar energy for this purpose, despite being promising, is still under consideration. In their recent study, Chowdhury et al. (2018) considered a single configuration for energy collection and storage, without penetrating into the trade-offs between different energy storage and vehicle technology systems.
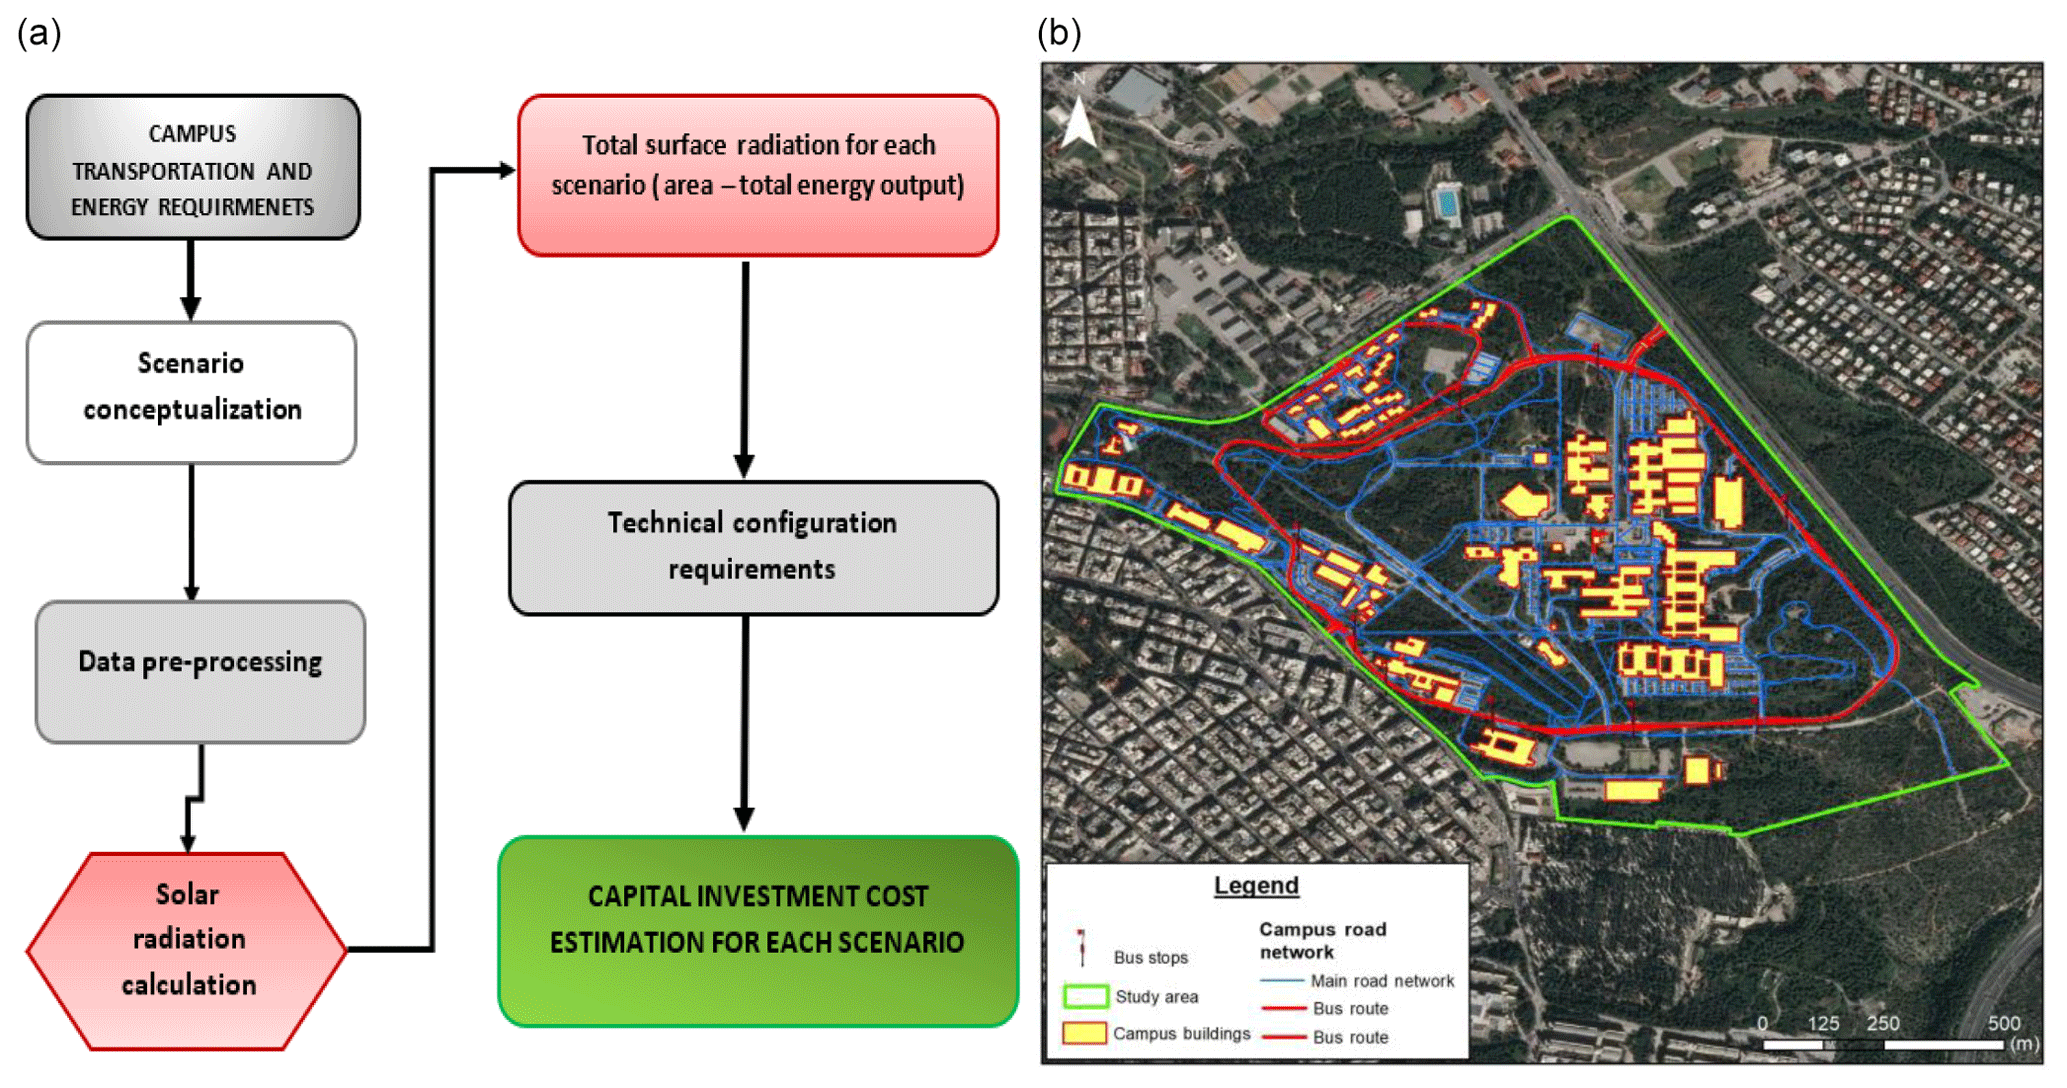
Figure 1(a) Flowchart of the methodology. (b) Vectorized data of the study area (road network, bus stops, buildings, boundaries – Base Map Layer: Bing Map v.7, Bing Satellite Base Map).
In this context, this study explores the prospect of replacing conventional university campus buses powered by fossil fuels with electric ones powered in priority by solar energy stored in batteries, but also connected to the central electricity grid. On the basis of existing infrastructure and facilities in the NTUA campus in Athens (Greece), three scenarios are developed for the collection and use of solar energy for electric buses: (1) bus stations shelters covered with solar panels, (2) unused open spaces with solar panels, and (3) solar roads, i.e. specially engineered panels that can be installed on road surface. Since the availability of solar energy is linked to sunshine levels, we explore the flexibility in the siting of panels in each scenario, to select the locations with the highest solar radiation. In the context of preliminary investigation, capital cost and energy consumption of the selected vehicles, charging stations and solar panels are investigated as well. A flowchart of the study is presented in Fig. 1. Finally, the least intensive scenario in terms of capital cost, i.e. solar panels in open space, is simulated using observed daily solar radiation data from a station inside the campus to investigate the performance of the system at the daily scale in terms of reliability and profitability arising from the process of buying and selling energy to the grid. We also evaluate the effect of the scale of the installation of the PV panels to profit and reliability by repeating the analysis for various sizes of the PV area.
The design of a solar-powered transportation system requires topographic, transportation as well as solar radiation data. First, the energy demands for the routes are identified using an average figure for energy consumption per distance unit, i.e. 1.35 kWh km−1 (Jang, 2018; Gao et al., 2017). Although this is a crude estimate, it is reasonable, since, inside the campus, there is no significant stop and go traffic neither large road segments with steep slopes. Route operational characteristics are collected through the website of the Athens Public Transport Operator (http://www.oasa.gr/, last access: 21 November 2019). The route is circular and connects the metro line to the university comprising 19 bus stops, 10 of which outside the campus (Fig. 1). Three buses run 239 d a year and the number of bus routes operated daily is 66 covering a total of 495 km. Therefore, in terms of route energy requirements, the total amount is approximated as 495 km d kWh km−1 = 668.25 kWh d−1. Additionally, elevation data (Digital Elevation Model – DEM) are acquired from Hellenic Cadastre at a spatial resolution of 5 m (Fig. 2). Last, available solar panel and electric bus technologies are examined. The chosen configurations for the electric buses in terms of battery and charger types are based on the data reported from recent literature (Lajunen, 2018; Liu and Song, 2017; Laizāns et al., 2016) and are analyzed in Sect. 4.
For the siting of the PV panels at the NTUA campus, solar radiation is calculated at the spatial scale of the DEM using the solar radiation analysis tool of ArcGIS, taking into account topographic effects (Mamassis et al., 2012). The Area Solar Radiation tool of ArcGIS is based on methods of the hemispherical viewshed algorithm developed by Fu (2000) and Fu and Rich (2002). The method consists of summing direct and diffuse radiation for every location on the topographic surface, using a centroid at zenith angle and azimuth angle, at the case of direct, and corrected by the gap fraction and angle of incidence, at the case of diffuse radiation. The DEM of the NTUA campus used in the analysis is expanded to include adjacent hills that cause shading to the campus area at the morning hours. For the preliminary stage of the feasibility analysis, the clearness index is assumed constant disregarding its temporal variation (i.e. no diurnal, seasonal or annual fluctuations) and with uniform spatial distribution over the area of the campus. We consider the clearness index equal to 0.6 as estimated by the expected hourly value of the clearness index during daylight over the campus (Koudouris et al., 2017).
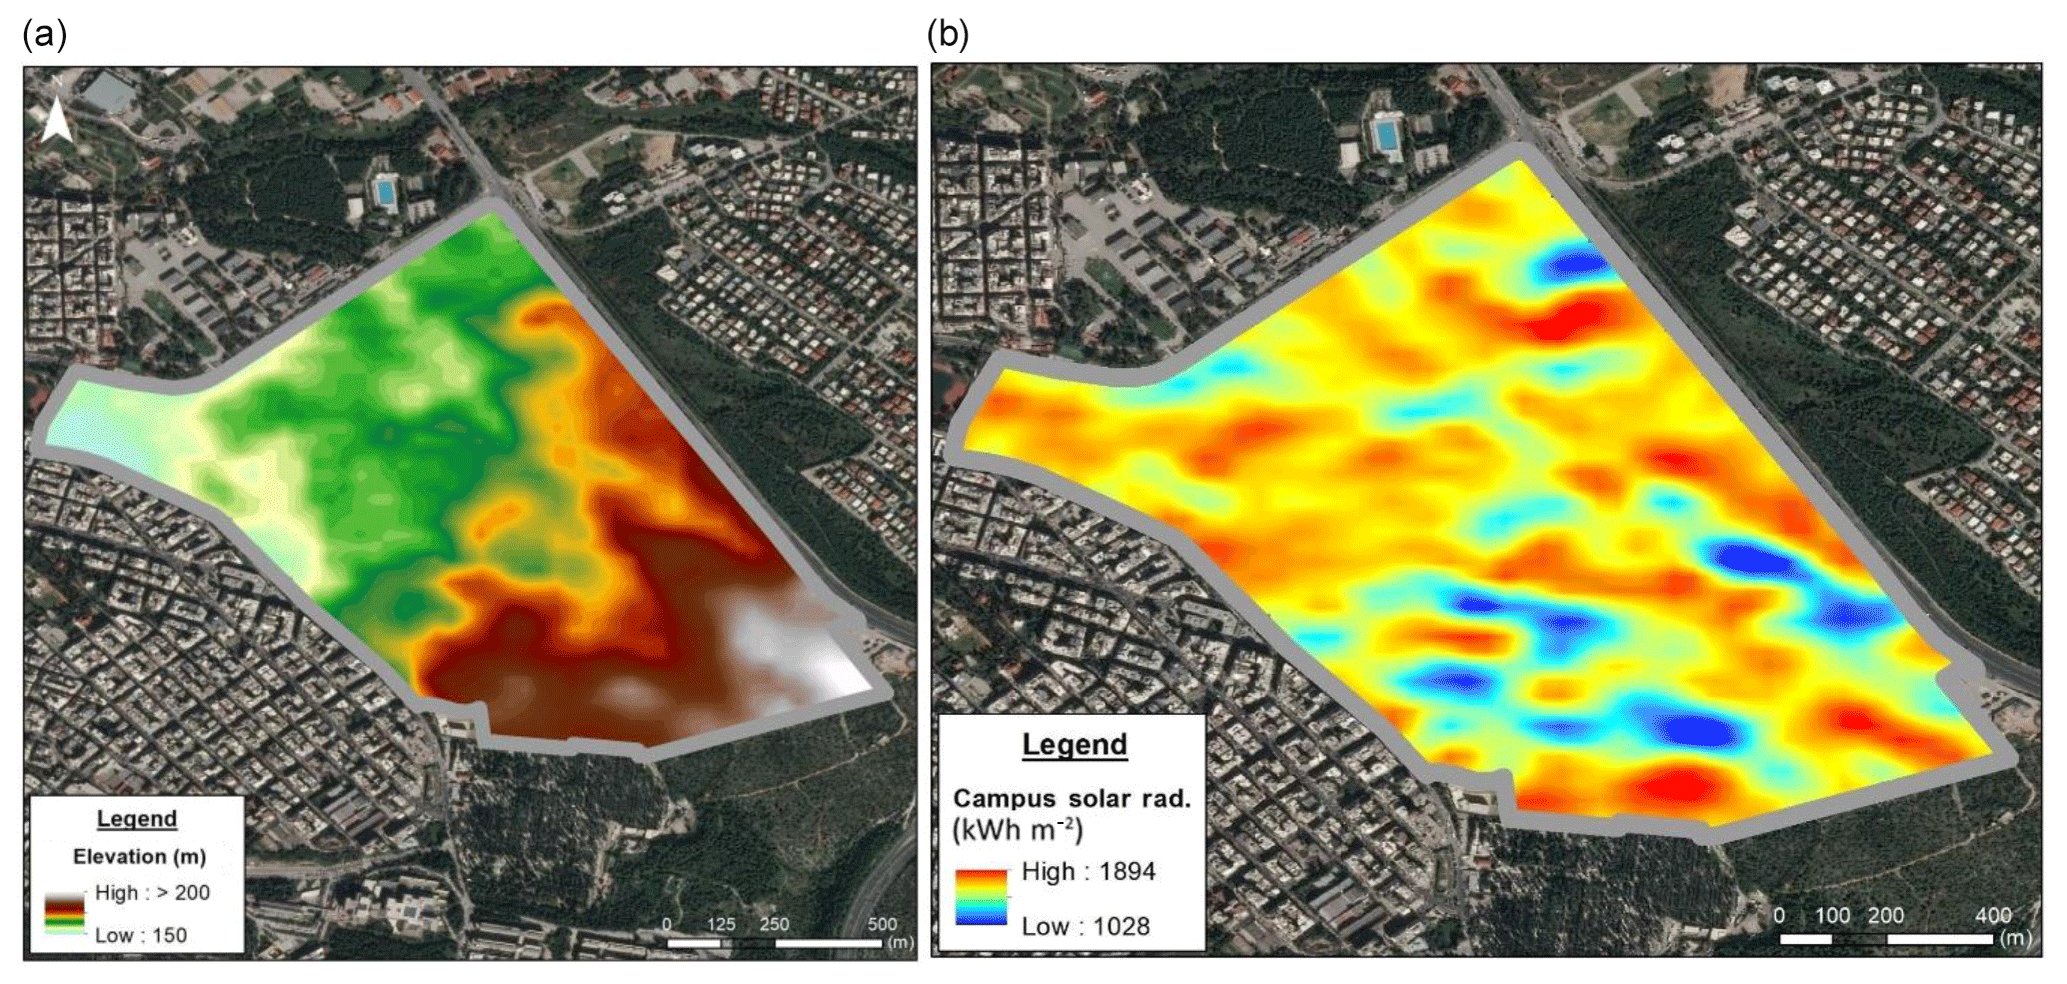
Figure 2(a) Digital elevation model (DEM) of the campus. (b) The total solar radiation at the campus area. (Base Map Layer: Bing Map v.7, Bing Satellite Base Map).
The surface solar energy (kWh) is calculated as:
where S is the solar irradiance during the days of operation (kWh m−2), i.e. 239 d yr−1, and A (m2) is the direct area in which solar panels are installed in each case. Photovoltaic energy generation is calculated as:
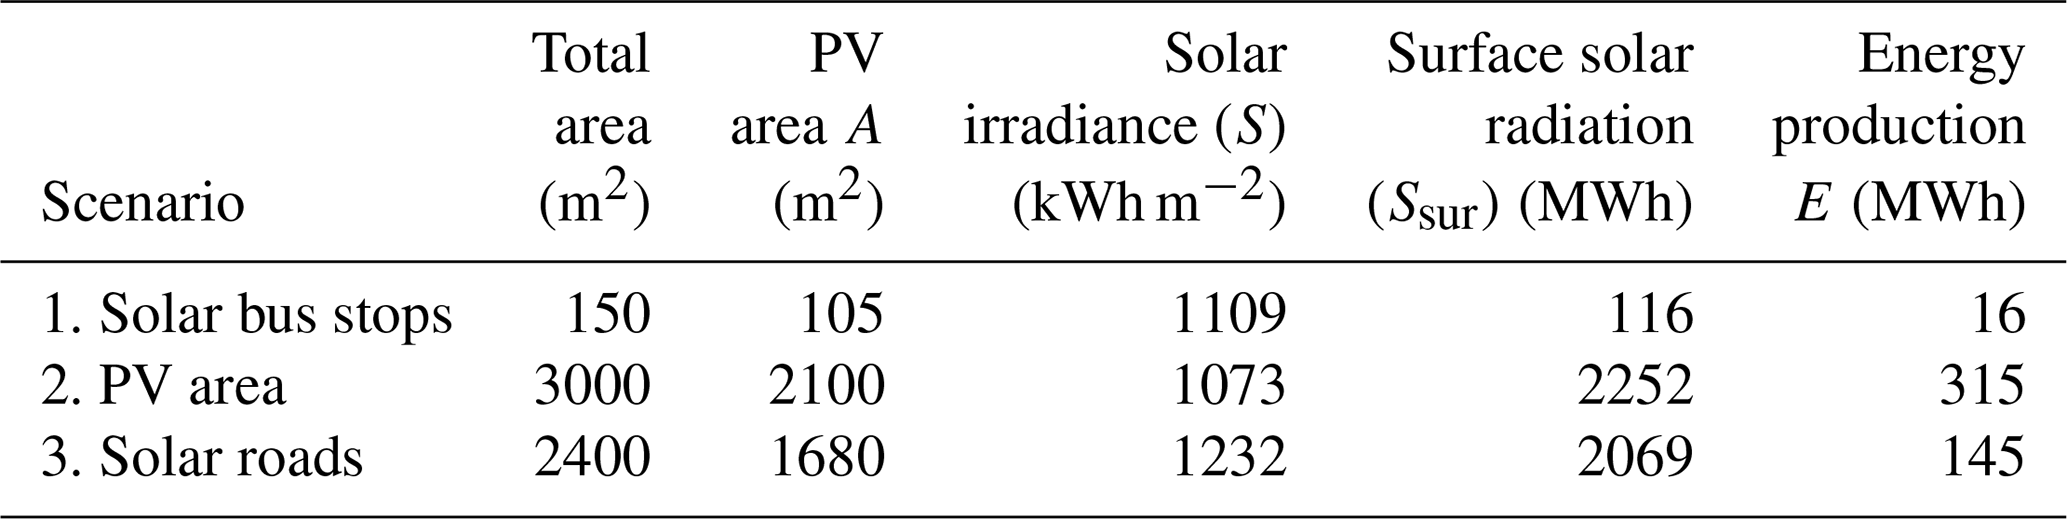
where the capacity factor (CF) of the conventional solar panels, which ranges between 13 %–17 % (WEC, 2016) and for our study is assumed as 14 % (following Jewel et al., 2006), while that of solar roads as 7 % due to decreased performance from the use of thick protective glass, shading from moving cars and the accumulation of dust, as explained in Sect. 4.3. The resulting raster layer of solar radiation at the NTUA campus (Fig. 2) is used to select the locations for installing solar panels in each scenario, where possible, among the available areas (Table 1). Out of the three scenarios examined, scenario 3, i.e. solar roads, albeit its lowest efficiency in terms of harnessing solar radiation, allows the greater flexibility in the selection of locations for the installation of solar roads, due to the large availability of road surface at the campus. In particular, the top 2400 m2 in terms of solar radiation are selected out of the total road area of NTUA, which is 37 970 m2 (Fig. 4). In the other two scenarios, siting of solar panels is restricted by existing locations of bus stops, in scenario 1, and by the availability of large and unused open spaces, in scenario 2. In the case of solar bus stops, a slightly higher average solar radiation is achieved by selecting the 5 out of 9 existing campus bus stops that receive the maximum radiation.
Table 1Total area used, direct PV area (A), total solar irradiance (S), total surface solar radiation (Ssur) and total solar energy production (E) during days of operation per year for the three scenarios.
Three scenarios are explored for the collection and use of solar energy: (1) solar panels installed on the top of bus station shelters (2) solar panels installed at unused open spaces and (3) road segments constructed by photovoltaic material, commonly referred to as solar roads. In all three cases, it is assumed that a stationary charger at the terminal is required for the vehicles to start the routes fully charged (Gao et al., 2017). In the following sections, we analyze of each scenario in terms of its technical configuration and energy produced.
4.1 Scenario 1: Solar bus stops
In this scenario, we explore the emerging concept of solar bus stops, i.e. bus stops collecting solar energy either from their shelter constructed from PV material or from PV panels installed in close proximity to the bus stop and transporting the energy to buses via induction (Franken and Meijer, 2014; Kawashima and Fujioka, 2008). This charging configuration is referred to as opportunity charging, as buses charge during dwell times at stops through high-power chargers (Iliopoulou et al., 2019; Lajunen, 2018). In this case, we assume that candidate stop locations must be within the campus, while the stops exposed to the highest amount of solar radiation must be exploited. For this purpose, based on the resulting solar radiation map (Fig. 1), we select the stops located at the areas exposed to the highest amount of solar radiation. These are five stops namely those at Gate Kokkkinopoulou, Gate Katechaki, School of Civil Engineering, School of Naval Engineering and Student Housing. The selected stops are also associated with high passenger loads (Asimomiti et al., 2019), thus they constitute advantageous locations for charging during dwell times. The short route length and thus, the corresponding low energy requirements, allow for the deployment of low-capacity high-power batteries of 30 kWh (Jungmeier, 2017). Further, we assume high-power charging of 200 kW and 60 s recharging during dwell times, which are typical values for the concept of opportunity charging (Jungmeier, 2017; Jang, 2018). Under these specifications, a typical energy consumption and recharging scheme for two consecutive routes is shown in Fig. 3, assuming 97 % charger efficiency (Gao et al., 2017). Vehicles need to recharge approximately every hour, as the average cycle time is 40 min with small daily fluctuations while as shown in Fig. 3 charging is required every other route. The solar roof of each bus stop is assumed to be 30 m2 (10 m × 3 m), a value within the literature range (Kawashima and Fujioka, 2008). Based on the average annual solar radiation at the campus (1109 kWh m−2 yr−1), the solar energy per year at the area of all bus stops is 166 MWh. Considering the solar panel efficiency rate (14 %), the production of electricity during the year amounts to 16 MWh in total, or approximately 16/239 = 0.067 MWh d−1 on average for each day of operation. These calculations are summarized in Table 1. Obviously, the solar panels at the bus stops do not provide enough energy to autonomously operate the buses and a total of 572 kWh d−1 of supplementary electricity from the grid would be required on average.
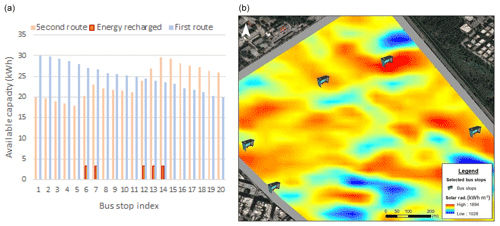
Figure 3(a) Energy consumption and recharging route profile. (b) The five selected bus stops receiving the highest solar radiation amount (Base Map Layer: Bing Map v.7, Bing Satellite Base Map).
4.2 Scenario 2: Open space with solar panels
In this scenario, we consider the concept of overnight charging, where buses charge in depots during night time, storing the energy in a high-capacity battery of 700 kWh. In this configuration energy is produced from an open parking area of 3000 m2 inside the campus (Fig. 4). The area of a commercial solar panel is assumed to be 1.93 m2 (Jewel et al., 2016), while its capacity factor is assumed as 14 % (Jewel et al., 2016). This area could allow for collection of 2252 MWh of solar energy per year. In turn, the solar panels can generate 315 MWh annually or approximately 1318 kWh d−1. This amount can adequately meet bus energy requirements on average. The surplus energy will be sold to the grid. Calculations are summarized in Table 1.
In the overnight charging method, solar energy collected in the daytime can be converted to electric power and stored in batteries. Assuming total energy requirements per vehicle of approximately 111 kWh d−1, electric buses with battery capacity of 150–180 kWh may be deployed, considering the usable capacity. With a medium-power 60 kW charger at the depot, an average charging duration of 3 h would be required to power up a vehicle of 180 kWh (Gao et al., 2017). This charging approach ensures credibility in running the routes while the large overnight charging durations are not an issue in this case, as the buses operate during day-time. To meet charging energy requirements for 3 vehicles, 1 charging station is required.
4.3 Scenario 3: Solar roads
The third scenario considers the installation of solar panels along segments of the NTUA campus road network, in order to collect solar radiation and dynamically power the buses as they move along them using induction (Karataraki et al., 2019; Venugopal et al., 2018). To select these segments, total annual solar radiation on the campus roads is mapped using GIS software according to the process described in Sect. 3. Figure 4 illustrates the annual radiation for the PV area along the route.
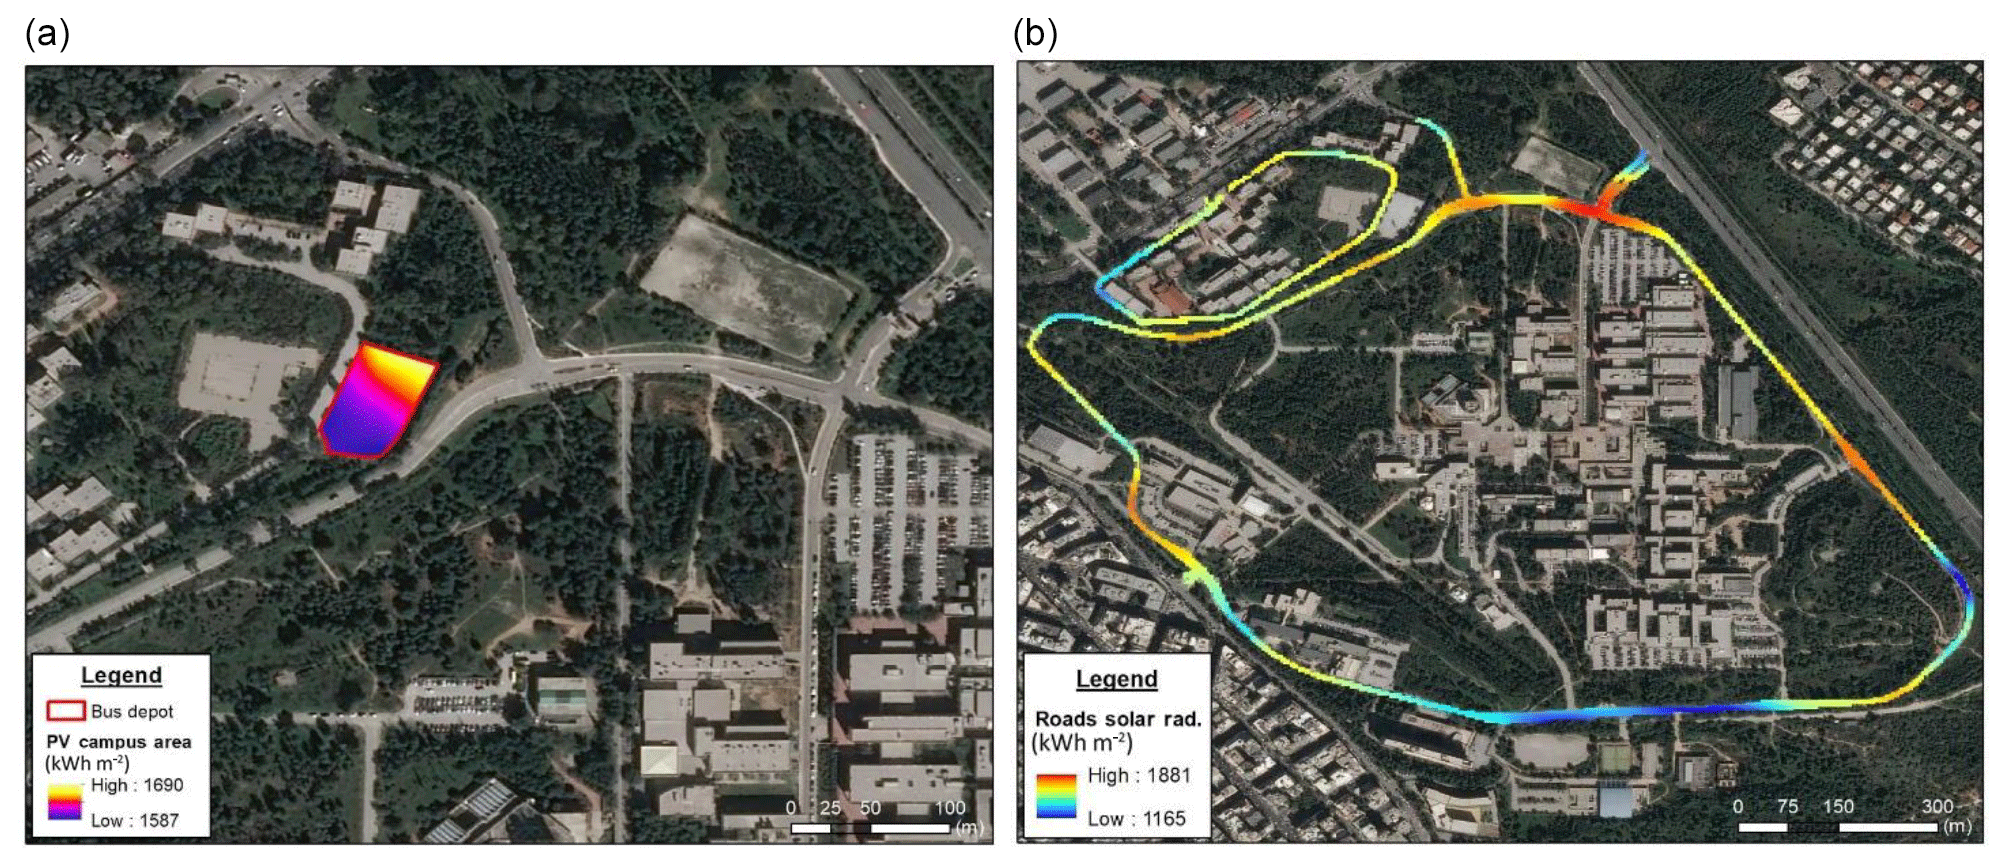
Figure 4(a) Solar radiation at the open space PV area (scenario 2) and (b) at the solar roads surface (scenario 3). (Base Map Layer: Bing Map v.7, Bing Satellite Base Map).
The total road surface of the NTUA campus, shown in Fig. 4, is 37 970 m2. Based on the results shown in Fig. 4 on road solar radiation, road segments of approximately 300 m in length and 8 m in width (the total area is 2400 m2) are selected, using two criteria: high incoming solar radiation and low shading from buildings and trees. We also note that the selected areas have limited traffic and are not used for short-term parking. Not considering effects from dust accumulation and dynamic or static shading, the overall annual efficiency of similar set-ups has been estimated as 8.6 % (Shekhar et al., 2015). In this work, in order to account for shading from moving cars and increased concentration of dust, the capacity factor is slightly reduced to 7 %. However, it has to be noted that the capacity factor of such configurations has been reported as low as 4 % (https://www.independent.co.uk/environment/solar-panel-roads-energy-bad-idea-renewable-climate, last access: 21 November 2019). The total number of panels installed in this area is thus 1238 (2400/1.937), while the solar energy per year at the area is 2069 MWh. So, in one year 145 MWh can be produced (Table 1). For 239 d of operation, the solar roads could on average generate 145/239 = 0.607 MWh d−1.
4.4 Preliminary capital cost analysis and scenario comparison
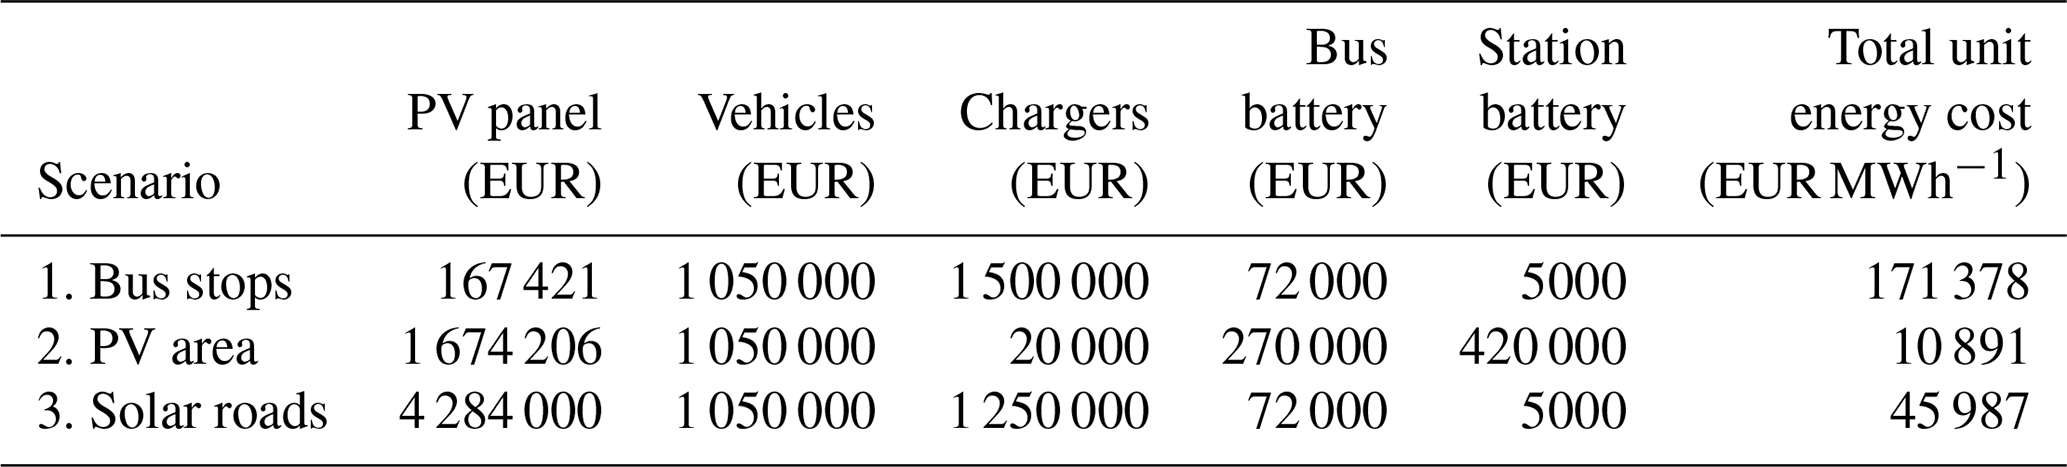
Indicative capital costs for each of the three scenarios are presented in Table 2, using the PV cost figures found in IRENA (2012) and assuming the costs for the electric buses and charging devices according to the analysis of Lajunen (2018). Namely, for the scenario of solar bus stops, costs for electric buses and dynamic charging devices are taken as EUR 350 000 and 250 000, respectively. Five chargers are required, plus one at the terminal. Regarding battery costs, the value of EUR 100 kWh−1 (Liu and Song, 2017) is assumed for low-capacity batteries used for the vehicles (3 batteries of 30 kWh) and for storing solar energy at the specific bus stops (5 batteries of 10 kWh each). For the scenario of PV panels in open space, one overnight charging device is required, with a unit cost of EUR 20 000, and high-capacity batteries for the buses (180 kWh) and for storing the PV area energy (700 kWh) at a cost of EUR 600 kWh−1 (Laizāns et al., 2016). Finally, for the solar roads' scenario, we assume four fast charging devices for the road segments plus one at the terminal, and the same battery configuration as in the solar bus stop scenario. Concerning the cost of PV panels per m2 (including installation and panels), a value of EUR 4465 kW−1 is assumed for conventional PV panels (IRENA, 2012) in open space, and twice as much (EUR 8930 kW−1) for PV panels in bus shelters. Finally, a value of EUR 1785 m−2 or EUR 11 905 kW−1 of installed capacity is used for the cost of solar roads, based on the costs reported for the recent large-scale solar road application in France (https://theconversation.com/solar-panels-replaced-tarmac-on-a-road-here-are-the-results, last access: 21 November 2019). Total costs are summarized in Table 2. At this stage lifecycle costs are not taken into account although it is expected that the solar roads' technology has the highest ones due to maintenance requirements, since the panels on the road can be easily broken or ruined (Karataraki et al., 2019).
Overall, the open space scenario is the most advantageous, in terms of capital cost per unit energy generation, with the primary drawback being the sub-optimal exploitation of space since the area of installation cannot support other operational uses as in the other two cases. Evidently, the solar bus stop technology is overly capital intensive, at the scale examined, as the cost for batteries, chargers and vehicles is prohibitive for a system with such low energy generation. Furthermore, there are not enough suitable stops in order to integrate this technology at a larger scale. Solar road technology on the other hand, suffers from high infrastructure cost and lower capacity factors, the combination of which leads to high capital costs per energy unit produced, even though the scale of the layout examined is comparable to the open space scenario. The total capital costs are EUR 171 378 per MWh of energy generated for solar bus stops, and this drops to EUR 10 891 for PV panels (scenario 2, which is the most advantageous). It should be also noted that this comparison refers to solar energy production and does not consider the power transfer efficiency of each charging scheme. In this case, greater discrepancies would arise between static and dynamic charging, as in the former case efficiencies up to 97 % can be attained (Gao et al., 2017) versus 80 for the latter (Jang, 2018).
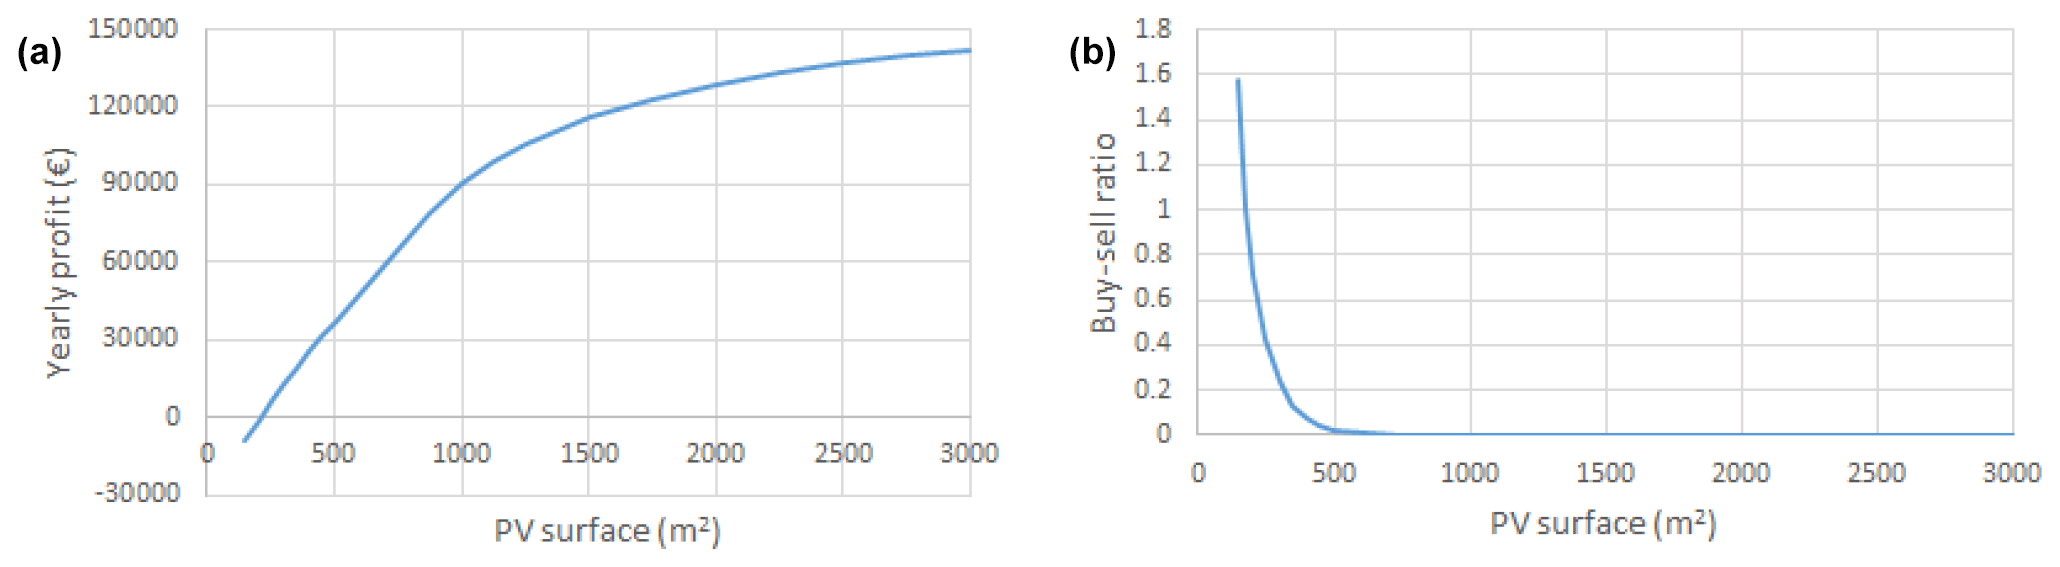
With both preliminary capital cost investigation and energy generation estimation converging to the prevalence of scenario 2, additional investigation is carried out for PV placement in open space, in terms of the relation of the scale of the system, i.e. the size of the PV surface, with profit and reliability. For this, a model for the daily operation of the system is developed based on the layout described in the corresponding section. Namely, this consists of an area of 3000 m2, in which 375 kW of PV panels are installed, with a 700 kWh battery for the charging station, used for overnight charging of the buses. The total daily consumption of the electric buses is 668.25 kWh and the system is connected to the grid, buying for EUR 0.18 kWh−1 when in deficit and selling for EUR 0.08 kWh−1 when in surplus1. To simulate the operation of the system on the daily scale, we use historical data of daily solar radiation from the meteorological station of NTUA spanning from 17 Nov 1998 to 5 Sep 2009 (https://openmeteo.org/stations/1334/, last access: 21 November 2019). From the simulation, we identify the occurrences where the energy demand was not met and thus energy is bought from the grid, as well as the occurrences in which there was energy surplus and therefore energy was sold to the grid. Accordingly, we estimate the buy-sell ratio, and the estimated yearly profit from the operation, both shown in Fig. 5. It is evident that the system becomes profitable only when the installed PV surface exceeds 206 m2 while it becomes nearly autonomous, i.e. achieving a 1 % buy-sell ratio, at 600 m2. Clearly, for a given configuration, the degree of autonomy of the system is mainly dependent on the natural variability of solar radiation, whereas its profitability is additionally highly dependent on the variable cost of buying and selling to the grid, which here is simplistically assumed to remain constant over the years. Therefore, in order to reach autonomy, a much smaller system could be employed, e.g. 600 m2, yet if profitability is a target, both the life-cycle cost of the system and the variability of the energy market should be considered.
Evidently, there is a lot of potential for the implementation of such systems in places receiving high solar radiation. Yet, more research is required in order to better account for the variability induced by the stochastic nature of solar radiation. Here we have used observed historical solar radiation data from a station inside the campus spanning approximately 10 years of daily data. We note that in general, the spatio-temporal variability of the hourly clearness index may be significant since it depends on local topographic characteristics (mostly affecting scenarios 1 and 3) and on the temporal variability, although we do not expect the spatial variability to be significant at such a small scale. The temporal variability is triggered by the short-term high autocorrelation as well as by the long-term behaviour identified from the time series analysis (Dimitriadis and Koutsoyiannis, 2015) of solar irradiation both over the area of interest and globally (Koudouris et al., 2017, 2018). A proper measure to express the strength of the long-term persistence of a stochastic process is the Hurst parameter, (Hurst, 1951; Koutsoyiannis, 2010). Interestingly, the Hurst parameter for the clearness index over the area of interest is estimated around 0.8 (Koudouris et al., 2017) indicating strong long-term persistence of the process and thus, a relevant model will be developed in future research to assess the degree of uncertainty induced from the variability of the clearness index based on synthetic solar radiation timeseries longer than the historical data used here.
However, even the single simulation of the system based on historical data is reflective of the effect of the scale of the system on both reliability, pertaining to minimizing the energy required from the grid, and profit, estimated from the process of buying and selling energy to the grid and assuming the present energy prices. Additional considerations on the scale of the system should take into account both potential conflicting uses of the available spaces as well as aesthetic issues relating to the potential degradation of the landscape (Sargentis et al., 2019).
Further research is required in order to quantify the whole life-cycle cost of the project, taking into account specifications about the batteries life-cycle as well as maintenance costs, which are expected to be significant particularly for solar road technology. Level of transit service provided by the different systems could also be investigated further (Papantoniou et al., 2019). For example, in scenario 1, additional stationary time in bus stops is required for charging in contrast to scenario 2, in which overnight charging is utilized. Efficiency of service was maintained in scenario 1 through the selection of stations with high on-off load for charging, but as part of a large investment on the campus transport system we believe that improving the efficiency of the system should also be investigated as well as the trade-off between heavier batteries for overnight charging and bus capacity (Vlahogianni et al., 2018).
Last but not least, it should be noted that the results are highly dependent on the selected capacity factor, which is shown to often deviate from theoretical values, especially in renewable energy technologies (Boccard, 2009; Ioannidis and Koutsoyiannis, 2019).
Solar energy is an important source of renewable energy presenting many opportunities for replacing conventional fossil fuels for various applications. In the light of emerging renewable energy technologies and transportation innovations, we explore the possibility to harness solar power to charge electric buses for a university campus bus route, utilizing three different solar energy set-ups. All investigated schemes employ electric buses that require charging equipment and infrastructure for their operation but differ in the employed solar energy installations; solar panels on top of bus station shelters (scenario 1), solar panels in available open spaces (scenario 2), and solar roads (scenario 3). Results demonstrate that differences are observed among scenarios both in the ratio of capital cost to expected energy generation as well as in the degree of siting flexibility, i.e. the availability of areas with high solar radiation potential and reduced shading.
Regarding the solar energy technologies examined, we note the low capital cost of conventional PV panels in relation to the alternative technologies. Evidently, scenario 2 is the most cost-effective, due to low capital cost of panels, low installation costs and lower cumulative cost of chargers and batteries for the electric buses. In fact, the requirement of expensive charging equipment in scenarios 1 and 3 and the high infrastructure cost of solar road technology are the most decisive factors for this discrepancy. Overall, we conclude that the utilization of solar energy in its most widely used form, photovoltaic panels in open spaces (scenario 2), is at the moment, the most cost-efficient way to introduce solar energy in small-scale transportation systems. This layout is advantageous because of lower capital and installation costs for PV panels as well as lower cumulative costs for battery and chargers for the electrical buses. Meanwhile, advantages related to siting flexibility for the optimal exploitation of incoming solar radiation, are case-dependent and might render technologies like solar roads and solar bus stops – or the combination thereof, necessary, in case open spaces for the installation of solar PV panels are unavailable.
In general, it is evident that in terms of reliability, even a small-scale open PV surface system, e.g. 300–600 m2 depending on the desired degree of autonomy, storing the daily solar energy at batteries and charging the buses overnight, is a viable option for the given location, which generally receives considerable amounts of solar radiation yearlong. Additionally, the overnight charging is expected to be the most advantageous charging scheme as in contrast to charging at hourly intervals, it is not impacted by the sub-daily intermittency of solar radiation. Regarding profits, a simple analysis of the operation of buying and selling to the grid shows that the system is profitable even at a small scale (>200 m2), while profits generally rise with the increase of the scale. In any case, capacity factors are increasing as available technologies are becoming more efficient, shaping a future technological environment, in which these schemes will present an economically viable transportation scheme, with the environmental benefit of reducing dependency on fossil fuels. In this respect, small-scale closed systems, such as those located inside university campuses, present an ideal environment for testing the merits, as well as the technical and the economic viability of emerging renewable energy technologies.
Historical solar radiation data for the NTUA campus can be accessed at https://openmeteo.org/api/stations/1334/timeseries/231/data/?fmt=csv (last access: 21 November 2019; National Technical University of Athens, 2019). Elevation data (Digital Elevation Model – DEM) can be accessed upon request from the Hellenic Cadastre at http://www.ktimatologio.gr/sites/en/aboutus/Pages/qoQhyNCvtozm6ajS_EN.aspx (last access: 21 November 2019; Hellenic Cadastre and Mapping, 2019). The data are only provided for free to the Greek Public Sector.
Study conception: TI, PD, GK, RI; data analysis: RI, TI, CI, LK; data collection: LK, AP, MEM, MEA, NP; manuscript preparation: RI, TI, CI, LK, NM, PD; study supervision: DK, NM, KK, EIV, CP. All authors read and edited the manuscript.
The authors declare that they have no conflict of interest.
This article is part of the special issue “European Geosciences Union General Assembly 2019, EGU Division Energy, Resources & Environment (ERE)”. It is a result of the EGU General Assembly 2019, Vienna, Austria, 7–12 April 2019.
An initial version of this work, prepared by the graduating students and their advising tutors in terms of their projects, was presented in posters in the EGU 2019 Assembly. All students wish to acknowledge the School of Civil Engineering of NTUA for giving the opportunity for active participation into the research process. Authors gratefully appreciate the constructive comments by Dylan Ryan and an anonymous reviewer which helped improve the paper. We thank Attiko Metro S.A for providing financial support to students for their participation at the EGU General Assembly 2019.
This research has been supported by the Eugenides Foundation (Scholarship for doctoral studies in NTUA grant).
This paper was edited by Sonja Martens and reviewed by Dylan Ryan and one anonymous referee.
Asimomiti, M.-E., Pelekanos N., Dimitriadis P., Iliopoulou T., Vlahogianni, E., and Koutsoyiannis D.: Campus solar roads: Stochastic modeling of passenger demand, European Geosciences Union General Assembly 2019, Geophysical Research Abstracts, Vol. 21, Vienna, EGU 2019-10585, European Geosciences Union, available at: https://www.itia.ntua.gr/en/docinfo/1958/, last access: 21 November 2019.
Boccard, N.: Capacity factor of wind power realized values vs. estimates, Ener. Pol., 37, 2679–2688, https://doi.org/10.1016/j.enpol.2009.02.046, 2009.
Brusaw, S. D. and Brusaw, J. A.: Intelligent solar roadway system and solar roadway panels, available at: https://patentimages.storage.googleapis.com/c6/f6/53/961fd3c9514555/US20180102730A1.pdf (last access: 21 November 2019), 2018.
Chowdhury, N., Hossain, C., Longo, M., and Yaïci, W.: Optimization of Solar Energy System for the Electric Vehicle at University Campus in Dhaka, Bangladesh. Energies, 11, 2433, https://doi.org/10.3390/en11092433, 2018.
Dimitriadis, P. and Koutsoyiannis, D.: Climacogram versus autocovariance and power spectrum in stochastic modelling for Markovian and Hurst–Kolmogorov processes, Stoch. Environ. Res. Risk Assess., 29, 1649–1669, https://doi.org/10.1007/s00477-015-1023-7, 2015.
Duarte, F. and Ferreira, A.: Energy harvesting on road pavements: state of the art, P. Inst. Civil Eng., 169, 79–90, https://doi.org/10.1680/jener.15.00005, 2016.
Durham, S.: Energy generating shelter system and method U.S, available at: https://patentimages.storage.googleapis.com/ce/b4/08/3fcdb207017b1a/US20060207192A1.pdf (last access: 21 November 2019), Patent Application No. 10/679,075, 2006.
Franken, R. and Meijer, M.: International Positioning of the Dutch PV sector. RVO, Den Haag, the Netherlands, available at: https://www.cleantechholland.com/wp-content/uploads/2014/08/International-positioning-of-the-Dutch-PV-sector-final.pdf (last access: 21 November 2019), 2014.
Fu, P.: A Geometric Solar Radiation Model with Applications in Landscape Ecology, Ph.D. Thesis, Department of Geography, University of Kansas, Lawrence, Kansas, USA, available at: https://elibrary.ru/item.asp?id=5312529(last access: 21 November 2019), 2000.
Fu, P. and Rich, P. M.: A Geometric Solar Radiation Model with Applications in Agriculture and Forestry, Comput. Electro. Agr., 37, 25–35, https://doi.org/10.1016/S0168-1699(02)00115-1, 2002.
Gao, Z., Lin, Z., LaClair, T. J., Liu, C., Li, J. M., Birky, A. K., and Ward, J.: Battery capacity and recharging needs for electric buses in city transit service, Energy, 122, 588–600, https://doi.org/10.1016/j.energy.2017.01.101, 2017.
Hasapis, D., Savvakis, N., Tsoutsos, T., Kalaitzakis, K., Psychis, S., and Nikolaidis, N. P.: Design of large scale prosuming in Universities: The solar energy vision of the TUC campus, Ener. Build., 141, 39–55, https://doi.org/10.1016/j.enbuild.2017.01.074, 2017.
Hellenic Cadastre and Mapping (HCMA) S.A.: HCMA Digital Elevation Model – LSO) in spatial resolution of 5 m, available at: http://www.ktimatologio.gr/sites/en/aboutus/Pages/qoQhyNCvtozm6ajS_EN.aspx, last access: 21 November 2019.
Hurst, H. E.: Long-term storage capacity of reservoirs, Trans. Am. Soc. Civil Eng., 116, 770–799, 1951.
Iliopoulou, C., Tassopoulos, I., Kepaptsoglou, K., and Beligiannis, G.: Electric Transit Route Network Design Problem: Model and Application. Transp. Res. Rec., 2673, 264–274, https://doi.org/10.1177/0361198119838513, 2019.
Ioannidis, R. and Koutsoyiannis, D.: Generic quantification of landscape impact from major renewable energy technologies: A critical review with an unheralded first place, Appl. Energy, 11, under review, 2019.
IRENA: Renewable Energy Cost Analysis Solar Photovoltaics, Renewable energy technologies: Cost analysis series. IRENA Innovation Technology Center, Dubai, United Arab Emirates, avilable at: https://www.irena.org/-/media/Files/IRENA/Agency/Publication/2012/RE_Technologies_Cost_Analysis-SOLAR_PV.pdf (last access: 21 November 2019), 2012.
Jang, Y. J.: Survey of the operation and system study on wireless charging electric vehicle systems, Transp. Res. C: Emerging Tech., 95, 844–866, 2018.
Jewell, C., Shah, S., Patel, K., Jaramillo, J., Gorgas, P., Vienckowski, L., Bradbury, G., and Caceres, R.: A Solar Powered Bus Stop System, available at: https://pdfs.semanticscholar.org/a9bd/e157203e07204dff054bbeaa56be8670faa1.pdf (last access: 21 November 2019), 2016.
Jungmeier, G.: Battery Electric Buses Project in Task 33 of the International Energy Agency (IEA) on Hybrid and Electric Vehicles (HEV), Presented at Int Conference on Electric Mobility and Public Transport, Santiago, Chile, 10–11 May, 2017.
Karataraki, M., Thanasko, A., Printziou, K., Koudouris, G., Ioannidis, R., Iliopoulou, T., Dimitriadis, P., Plati, C., and Koutsoyiannis, D.: Campus solar roads: a feasibility analysis, European Geosciences Union General Assembly 2019, Geophys. Res. Abstr., Vol. 21, Vienna, EGU2019-15648-2, European Geosciences Union, available at: https://meetingorganizer.copernicus.org/EGU2019/EGU2019-15648-2.pdf (last access: 21 November 2019), 2019.
Kawashima, T. and Fujioka, I.: New Public Transportation System with Bus Charged Intermittently at Every Bus Stop Using Green Energy, J. Environ. Eng., 3, 374–384, https://doi.org/10.1299/jee.3.374, 2008.
Koudouris, G., Dimitriadis, P., Iliopoulou, T., Mamassis, N., and Koutsoyiannis, D.: Investigation on the stochastic nature of the solar radiation process, Energ. Proc., 125, 398–404, https://doi.org/10.1016/j.egypro.2017.08.076, 2017.
Koudouris, G., Dimitriadis, P., Iliopoulou, T., Mamassis, N., and Koutsoyiannis, D.: A stochastic model for the hourly solar radiation process for application in renewable resources management, Adv. Geosci., 45, 139–145, https://doi.org/10.5194/adgeo-45-139-2018, 2018.
Koutsoyiannis, D.: HESS Opinions “A random walk on water”, Hydrol. Earth Syst. Sci., 14, 585–601, https://doi.org/10.5194/hess-14-585-2010, 2010.
Laizāns, A., Graurs, I., Rubenis, A., and Utehin, G.: Economic viability of electric public busses: Regional perspective, Proc. Eng., 134, 316–321, https://doi.org/10.1016/j.proeng.2016.01.013, 2016.
Lajunen, A.: Lifecycle costs and charging requirements of electric buses with different charging methods, J. Clean. Prod., 172, 56–67, https://doi.org/10.1016/j.jclepro.2017.10.066, 2018.
Liu, Z. and Song, Z.: Robust planning of dynamic wireless charging infrastructure for battery electric buses, Trans. Res. Part C: Emerg. Technol., 83, 77–103, https://doi.org/10.1016/j.trc.2017.07.013, 2017.
Mamassis, N., Efstratiadis, A., and Apostolidou, I. G.: Topography-adjusted solar radiation indices and their importance in hydrology, Hydrol. Sci. J., 57, 756–775, https://doi.org/10.1080/02626667.2012.670703, 2012.
National Technical University of Athens – Department of Water Resources and Environmental Engineering, NTUA University Campus of Zografou – Solar radiation (1998–2009), available at: https://openmeteo.org/api/stations/1334/timeseries/231/data/?fmt=csv, last access: 21 November 2019.
Papantoniou, P., Yannis, G., Vlahogianni, E. I., Attard, M., Regattieri, A., Pilati, F., an Piana, F.: Developing a sustainable mobility action plan for university campuses, 15th World Conference on Transport Research, 26–31 May, Mumbai, India, 2019.
Sargentis, G., Dimitriadis, P., Ioannidis, R., Iliopoulou, T., and Koutsoyiannis, D.: Stochastic Evaluation of Landscapes Transformed by Renewable Energy Installations and Civil Works, Energies, 12, 2817, https://doi.org/10.3390/en12142817, 2019.
Shekhar, A., Klerks, S., Bauer, P., and Prasanth, V.: Solar road operating efficiency and energy yield–an integrated approach towards inductive power transfer, European Photovoltaic Solar Energy Conference and Exhibition (EU-PVSEC), 2614–2619, available at: https://repository.tudelft.nl/islandora/object/uuid%3Ab74a7682-1559-4c81-9a11-f77d1c5ac9e8 (last access: 21 November 2019), 2015.
Venugopal, P., Shekhar, A., Visser, E., Scheele, N., Mouli, G. R. C., Bauer, P., and Silvester, S.: Roadway to self-healing highways with integrated wireless electric vehicle charging and sustainable energy harvesting technologies, Appl. Energy, 212, 1226–1239, https://doi.org/10.1016/j.apenergy.2017.12.108, 2018.
Vlahogianni, E., Papantoniou, P., Yannis, G., Attard, M., Regattieri, A., Piana, F., and Pilati, F.: Analysis of Mobility patterns in selected University Campus Areas, Proceedings of the 4th Conference on Sustainable Urban Mobility – CSUM 2018, Skiathos Island, Greece, 24–25 May, 2018.
WEC: World Energy Resources 2016 (24th edition), available at: https://www.worldenergy.org/assets/images/imported/2016/10/World-Energy-Resources-Full-report-2016.10.03.pdf (last access: 21 November 2019), 2016.
Actual values used have seasonal fluctuation and are scalable. These are averages from price lists in Greece in 2018.
- Abstract
- Introduction
- Data collection
- Area solar energy estimation and siting of PV panels
- Scenario Analysis
- Simulation of the daily operation of the open space PV system
- Discussion
- Conclusions
- Data availability
- Author contributions
- Competing interests
- Special issue statement
- Acknowledgements
- Financial support
- Review statement
- References