 | 04 Apr 2019
Evaluating the SWAT model to predict streamflow, nitrate loadings and crop yields in a small agricultural catchment
Andreas Bauwe
Petra Kahle
Bernd Lennartz
This study aimed to evaluate the applicability of the Soil and Water Assessment Tool (SWAT) to predict streamflow, nitrate loadings and crop yields for a small agricultural catchment in northeastern Germany. To this end, a 167 ha catchment was delineated consisting of 10 hydrological response units. Daily data for streamflow and nitrate loadings from 2004 to 2015 were used to calibrate and validate the model, while annual values for crop yields (winter wheat, winter barley, rapeseed, maize silage) were available. In addition, the detailed field maps provided by the local farmer were used to implement exact crop rotations and nitrogen fertilization into the model. Nash-Sutcliffe-Efficiencies for streamflow were 0.54 during the calibration and 0.57 for the validation period. The modeling performance for nitrate loadings were lower with 0.31 for the calibration and 0.42 for the validation period. The average crop yields were reproduced well, while SWAT failed to reproduce the inter-annual crop yield variations. A scenario analysis revealed that a slight decrease of nitrogen fertilization leads to significant reductions in nitrate loadings, while crop yields remained on a high level. The outcome of the study may help practitioners to operate according to an economic and environmental optimal N management. Nevertheless, experimental studies with varying fertilization intensities at catchment scale are needed to underpin the modeling results.
- Article
(2955 KB) - Full-text XML
- BibTeX
- EndNote


A surplus of plant nutrients, in particular nitrogen (N) and phosphorus (P), can lead to pollution and eutrophication of surface waters. Numerous studies show that diffuse inputs from agriculture are the main source of nutrients into groundwater and surface water bodies, including coastal waters. The EU Water Framework Directive requires member states to achieve a good ecological status of water bodies by 2027 (European Parliament and European Council, 2000). To achieve this goal, Germany must make further efforts to reduce nitrate pollution. For example, the permissible limit of 50 mg L−1 for is exceeded at 28 % of all groundwater-monitoring sites in Germany (BMUB, 2017). These limits are also often exceeded in surface waters as for example water analyses of small streams in intensively used agricultural catchments of the northeastern German lowlands indicate (Tiemeyer et al., 2006; Kahle et al., 2018).
Various measures can contribute to the reduction of nutrient pollution of water bodies. Land management plays a key role because it regulates how much nutrient is supplied to the soil. The intensity of land use and thus the fertilizer regime have an effect on the nutrient status in the soil and thus affect the magnitude of nutrient loss into surface water bodies. Several studies have shown that a reduced use of fertilizers may lead to an improvement of water quality. A decrease of the N surplus during the last two decades was accompanied by a modest decrease of nitrate concentrations in surface waters in some European countries such as Belgium, Denmark, Ireland, the Netherlands, and the United Kingdom (van Grinsven et al., 2012). Another survey study highlights the importance of reduced N fertilization for reducing leaching (Di and Cameron, 2002).
The fertilizer regime also influences the crop yield. A multi-year experiment in Iowa, USA, indicated that reduced N fertilizer rates led to a reduction of concentrations and losses in subsurface drainage systems along with a reduced crop yield for corn and soybean (Lawlor et al., 2008). At the same time, a simulation study conducted in the same area for the same crops recommended reduced N application rates to reduce nitrate losses in subsurface drainage systems while maintaining the yield (Liang et al., 2018). A European study concluded that N fertilizer rates for maize could be reduced without affecting yield and net return (Basso et al., 2012). A literature survey revealed that the application of a precision N management of wheat could save N fertilizers from 10 % to 80 % and reduce residual N in the soil by 30 % to 50 % without reducing yields (Diacono et al., 2013). These examples illustrate that an optimized N management could both keep crop yields at a high level and minimize negative environmental effects on surface waters.
Simulation models are suitable tools for assessing the impact of various land use scenarios on water quality and harvested yield. A prerequisite is that a model in question is able to describe the hydrological processes in the landscape and the agricultural processes (e.g., fertilization regime, crop rotation) with sufficient precision. The widely used Soil and Water Assessment Tool (SWAT; Arnold et al., 1998) potentially meets these requirements. SWAT has been applied worldwide under a large range of climatic conditions, watershed sizes and a variety of research questions. However, mostly the model was applied to catchments >1 km2 (Gassmann et al., 2007). These model applications usually require a generalization and simplification of land management. The advantage of constructing a model for small catchment areas is the ability to reproduce accurate farming practices.
The calibration of crop yield is not often taken into account in SWAT studies to date (Sinnathamby et al., 2017). These authors focused on simulating crop yield for corn and sorghum by using field data and recommended crop-yield calibration to reduce systematic errors of hydrological processes such as streamflow. A calibration of crop biomass and yield in order to represent correctly the watershed hydrology and the nutrient balance is also suggested by Nair et al. (2011). Our literature review revealed that SWAT studies simulating crop yields focused mostly on US watersheds with the main crops corn and soybean (e.g., Srinivasan et al., 2010; Nair et al., 2011; Guo et al., 2018). However, some researchers simulated yields for major crops in European watersheds, either at a continental scale (Abbaspour et al., 2015), for large river basins as the Danube (Malagó et al., 2017) or for mesoscale catchments (Maier and Dietrich, 2016).
In this study, SWAT was utilized to (i) test its applicability in predicting -N loadings and crop yields for a small agricultural catchment. To this end, we built a SWAT model based on real land management data from 2004 to 2015. In addition, we estimated (ii) the influence of the amount of N fertilization on crop yields and on nutrient losses at the catchment outlet. By doing so, we were able to evaluate simultaneously the impact of N management on crop yield and on surface water quality.
2.1 Study area
The study area is located in northeastern Germany near the city of Rostock (Fig. 1). It is 167 ha in size and under intensive agricultural use and contains a small proportion of forests (5 %). The crop rotation is typical for the region and comprises mainly winter wheat, winter barley, rapeseed, and maize silage. The catchment is located in a glacially formed landscape with a flat topography and only gentle slopes. Mineral soils are characteristic of the area, with a predominance of Luvisols (48 %), Gleysols (43 %), and Stagnic Gleysols (9 %). The four agricultural fields in the study area (Fig. 1) are tile-drained to improve soil aeration and agricultural management. Water originating from the tiles flows into a main ditch that crosses and eventually leaves the catchment (Fig. 1). Mean annual precipitation was 675 mm and the mean annual temperature was 8.8 ∘C (2004–2015). Due to low temperatures, the region is occasionally covered with snow in winter. Due to the high proportion of tile drainage, discharge is mainly controlled by tile flow and groundwater flow (Bauwe et al., 2016). In contrast, surface runoff is only observed during heavy storm events.
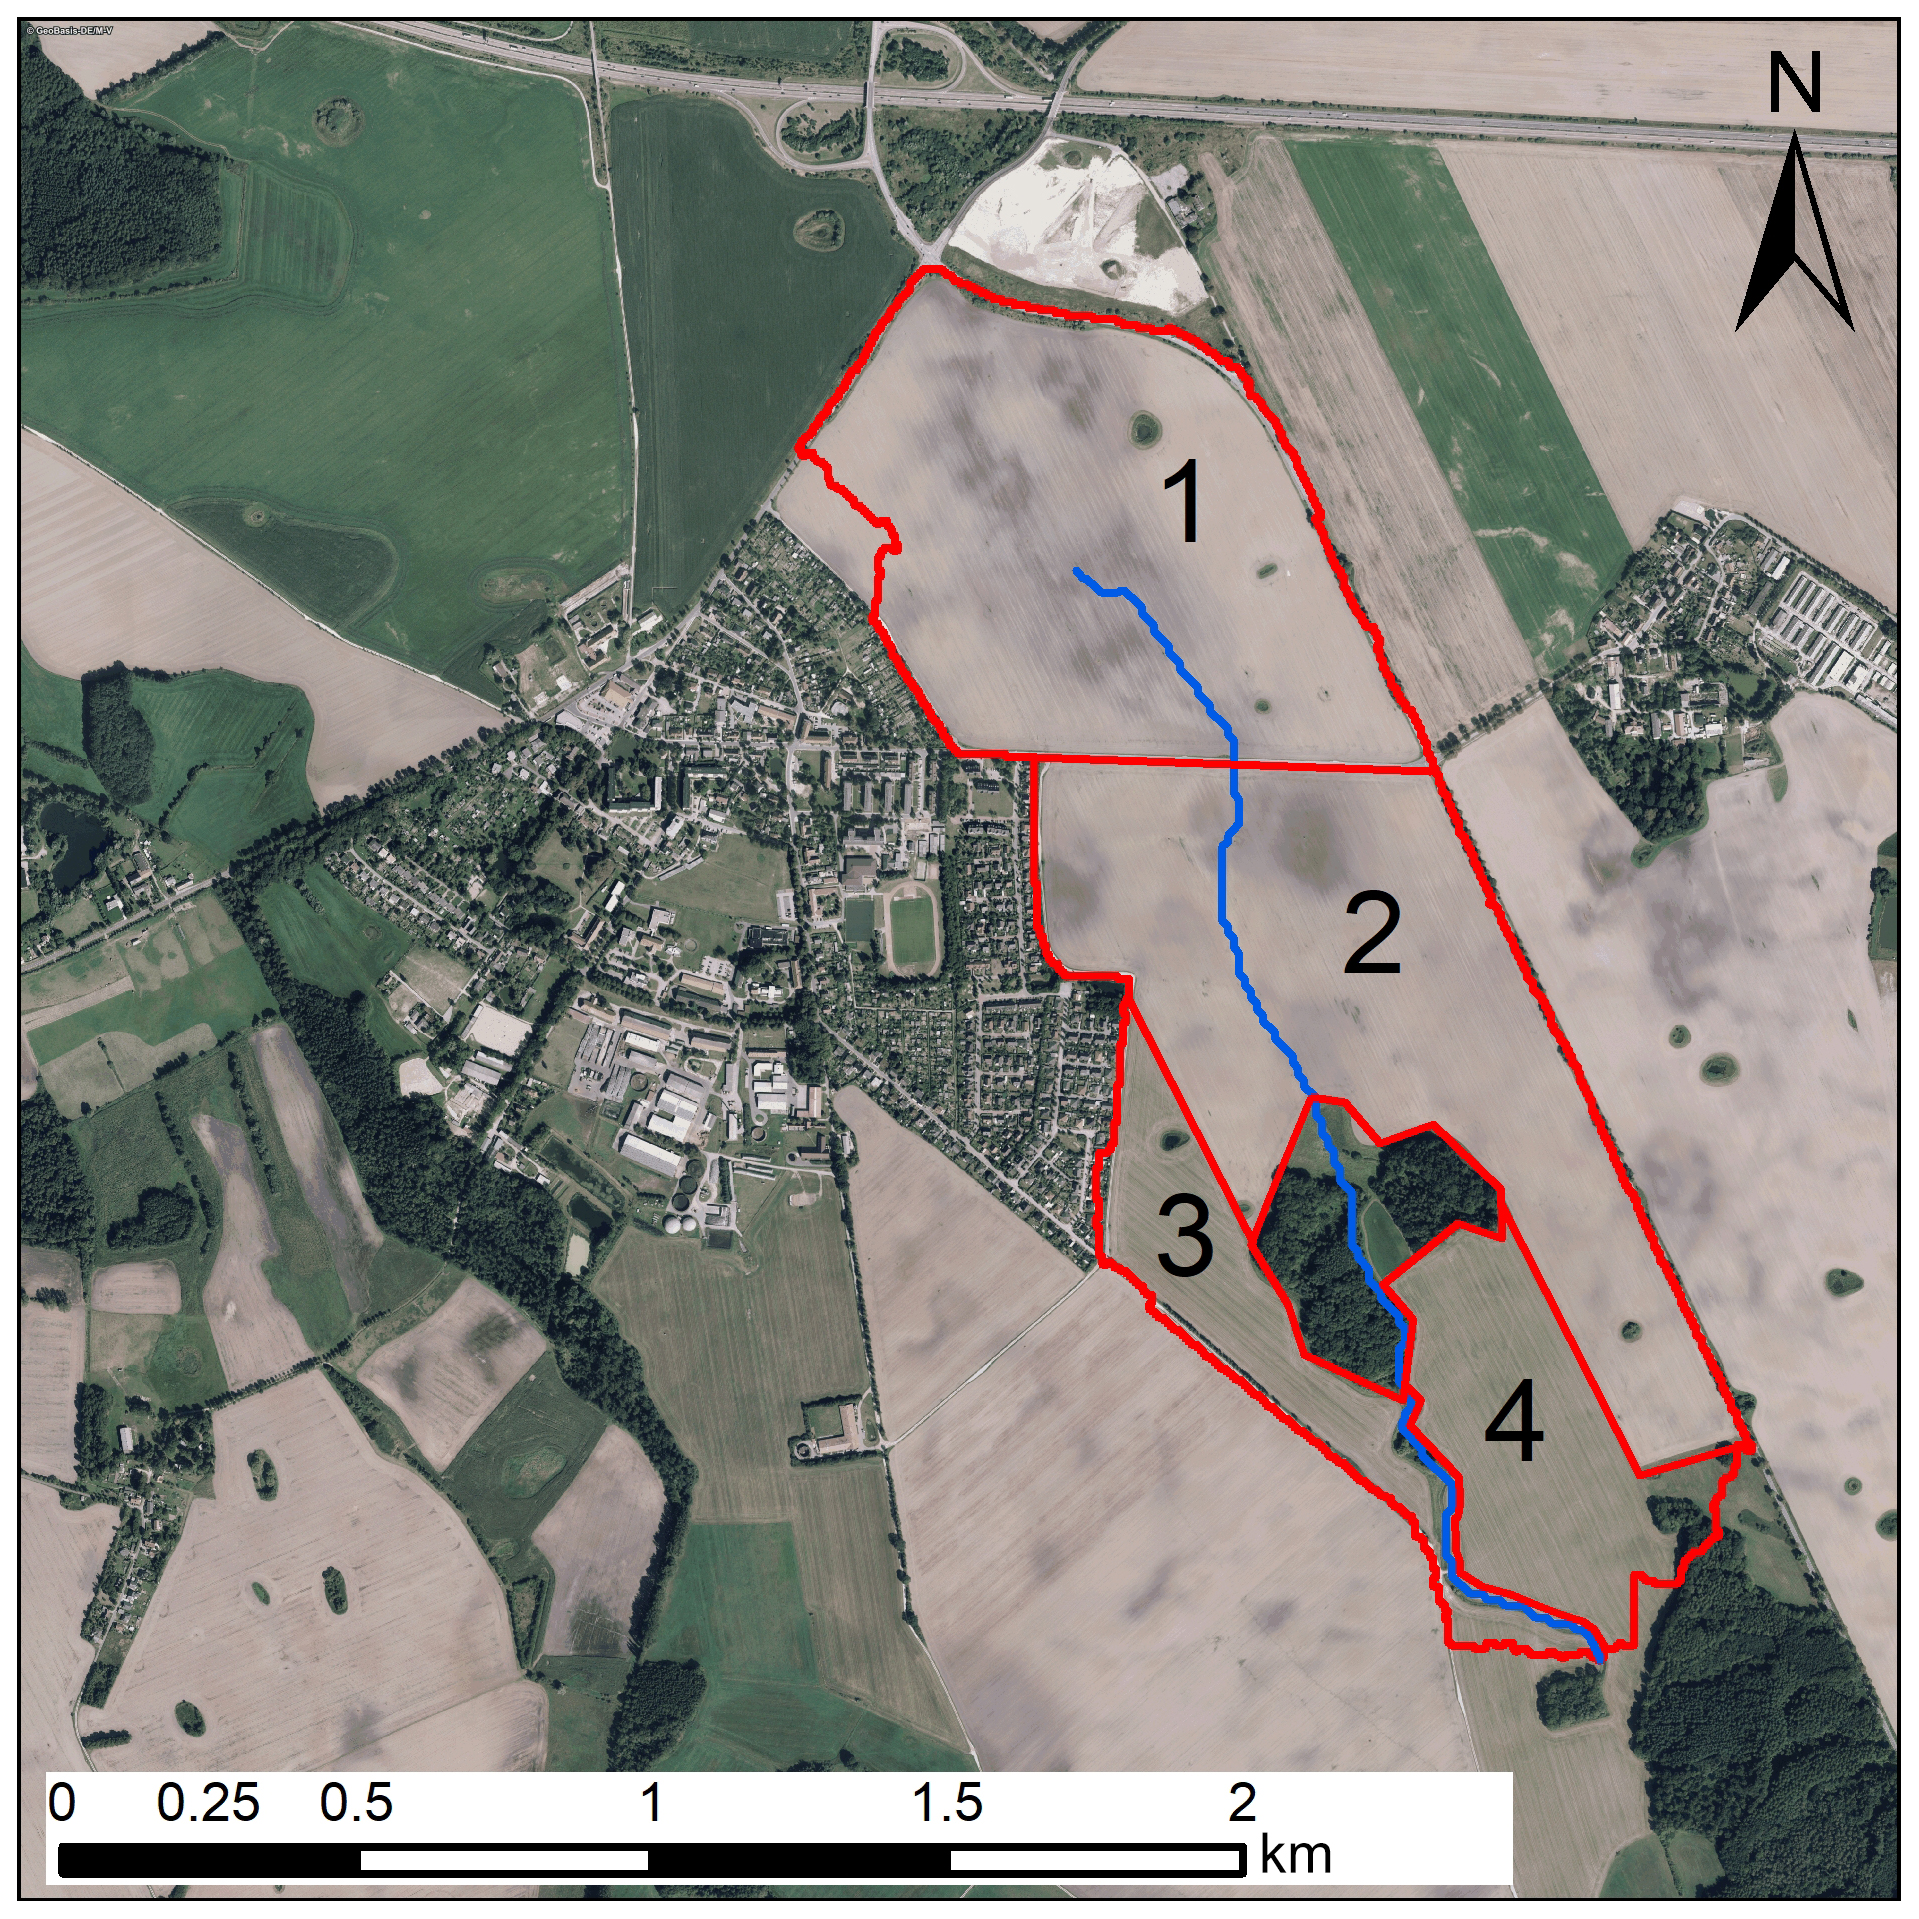
Figure 1Study area including catchment boundaries (red), stream (blue), and arable fields (numbers).

2.2 Land management
The field maps of the local farmer that included all agricultural measures were used to implement crop management into SWAT. Figure 2 provides an overview of the planted crops on the individual fields covering the investigation period. Typical crops were winter wheat, winter barley, rapeseed, and maize silage. Occasionally, sugar beet and legumes such as peas were also grown. With a strong focus on cereals, maize and rapeseed, the cultivation plan represents the typical conventional farming practice in northern Germany.
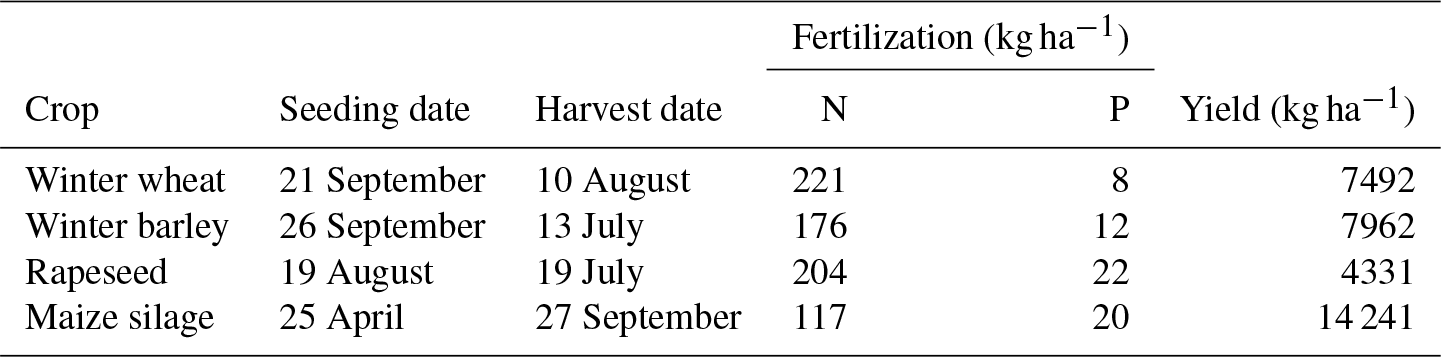
The crops received average annual N and P fertilizer applications of 180 and 16 kg ha−1, respectively (Table 1). The N fertilizers were applied three to four times a year, mostly in mineral form. P was only applied as organic fermentation residue. Winter wheat and winter barley were seeded usually in the second half of September, while rapeseed was seeded about one month earlier. Maize silage, the only crop harvested in the same year, was seeded in late April. The crops were harvested from mid to late summer. Average yields for winter wheat, winter barley, rapeseed, and maize silage were 7492, 7962, 4331, and 14 241 kg ha−1, respectively.
Table 1Cultivated arable crops and crop management including average seeding/harvesting dates, fertilizer application and yields. The yield is given as dry matter.
2.3 The SWAT model
The Soil and Water Assessment Tool is a physically based, semi-distributed and process-oriented eco-hydrological model designed to simulate discharge, sediment yield, nutrient and pesticide loads, crop growth or management activities for river basins over long periods of time on a daily basis (Neitsch et al., 2011). The model divides the catchment in its entirety into sub-catchments, which are then subdivided in hydrological response units (HRUs). An HRU as the smallest calculation unit is defined as a unique combination of soil type, land use and slope class for each subbasin. The hydrological cycle simulated in SWAT comprises precipitation (including snowfall), evapotranspiration, river discharge, and groundwater recharge. Plant growth in SWAT is based on the accumulation of heat units. Nitrogen is modeled by SWAT in the soil profile taking into consideration five different organic and inorganic pools. Nitrogen may be transported into rivers via surface runoff, lateral flow, tile drainage water, and the shallow aquifer. A detailed model description can be found in Neitsch et al. (2011).
2.4 Input data
Land use types were derived by analyzing aerial photographs with a high spatial resolution (Fig. 1). Soil data were taken from a regional soil map (LUNG-MV, 2010) with a scale of 1:25 000. A digital elevation model with a 25×25 m grid cell resolution was used to delineate the catchment and the stream (LVA-MV, 2000).
A weather station at the catchment outlet run by our working group recorded temperature, wind speed, and precipitation. Precipitation was measured in a 0.1 mm resolution using a tipping bucket rain gauge and was aggregated to daily values. Relative humidity and global radiation data were obtained in a daily resolution from a nearby weather station (Groß Lüsewitz, 12 km away) maintained by the German Weather Service.
The ditch at the catchment outlet is equipped with an automatic, ultrasonic, water level measurement device. We conducted frequent (usually once per week) discharge gauging with an inductive flowmeter to develop rating curves. Daily discharge data from the ditch over a 12 year period from 1 January 2004 to 12 December 2015 were used to calibrate and validate the model. Water samples were taken automatically at least twice a week. Nitrate was analyzed by ion chromatography.
Daily -N loads were obtained as follows: (1) for days, at which -N concentrations were measured, the daily load may be simply calculated by multiplying streamflow and concentration. (2) for days, at which no nitrate concentrations were measured, nitrate loads were calculated using regression equations based on the relationship of nitrate loads to streamflow.
2.5 Modeling approach
The study catchment was delineated using ArcGIS 10.4, ArcSWAT Version 2012.10_4.19 and consisted of one subbasin and consequently one stream (Fig. 1). Ten HRUs captured the spatial variability with regard to land use, soil types, and slope gradients. We followed in principle the four-stage calibration approach suggested by Nair et al. (2011).
-
Parameter selection: Based on previous simulation studies in the same area (Bauwe et al., 2016, 2017) we selected 27 parameters for sensitivity analysis. We performed a global sensitivity analysis using SWAT-CUP (SWAT-CUP 2012, version 5.1.6.2, Abbaspour, 2014). Sensitive parameters with a p-value < 0.05 after one iteration consisting of 1000 simulations were used for streamflow and -N loading calibration (Table 2).
-
Streamflow calibration: Automatic calibration using Sequential Uncertainty Fitting (SUFI-2) was performed using five sensitive “flow” parameters with their ranges given in Table 2 for the first iteration (1000 model runs) using the Nash-Sutcliffe-Efficiency (NSE) as objective function. After the iteration, SWAT-CUP suggested new, usually narrower parameter ranges to reduce the uncertainty and enhance the model performance. These new parameters were taken over for the next iteration, unless the suggested parameters had no physical meaning (e.g., negative values). In those cases, parameters were adjusted manually. This procedure was repeated five times. After that, no further improvement of model performance could be achieved.
-
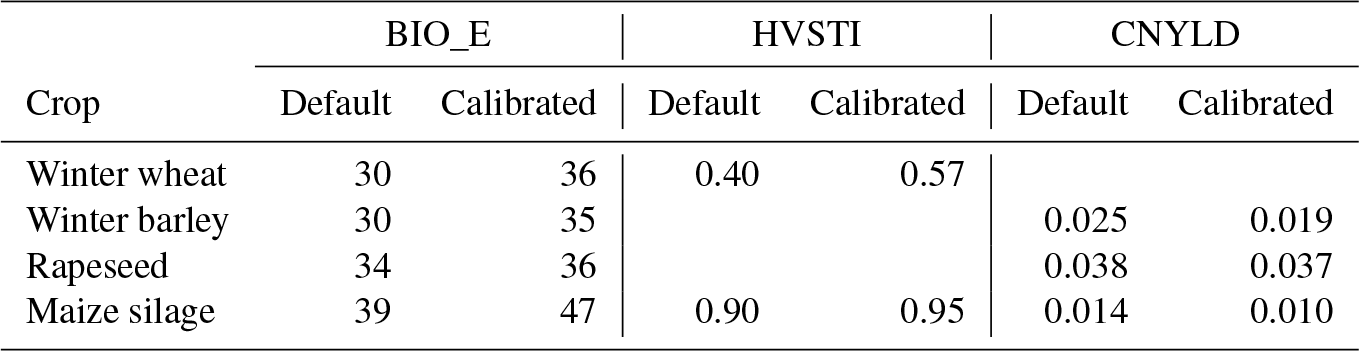
Crop yield calibration: Crop yield was calibrated manually by adjusting values of the plant parameter database (Table 3).
-
-N loading calibration: Finally, -N loadings were automatically calibrated using SWAT-CUP. To this end, two sensitive “nitrate” parameters (Table 2) underwent the same optimization procedure as streamflow.
The years 2002 to 2003 served as the warmup period, 2004 to 2009 as the calibration period, and 2010 to 2015 as the validation period. Simulations were performed using SWAT version 2012, Rev. 664.
Two indicators were used to evaluate daily model performance: NSE and percent bias (PBIAS) that are defined as follows:
where is the observed discharge, is the simulated discharge on day i and is the mean observed discharge. NSE can range from −∞ to 1, where 1 is a perfect match between simulated and observed data. PBIAS measures the tendency of the simulated values to be larger or smaller than the observed values. The optimum value is 0: values > 0 indicate underestimation and values < 0 indicate overestimation.
Table 2Calibrated parameters for streamflow and -N loadings. The range illustrates the chosen calibration range for each parameter. v – absolute change, r – relative change.
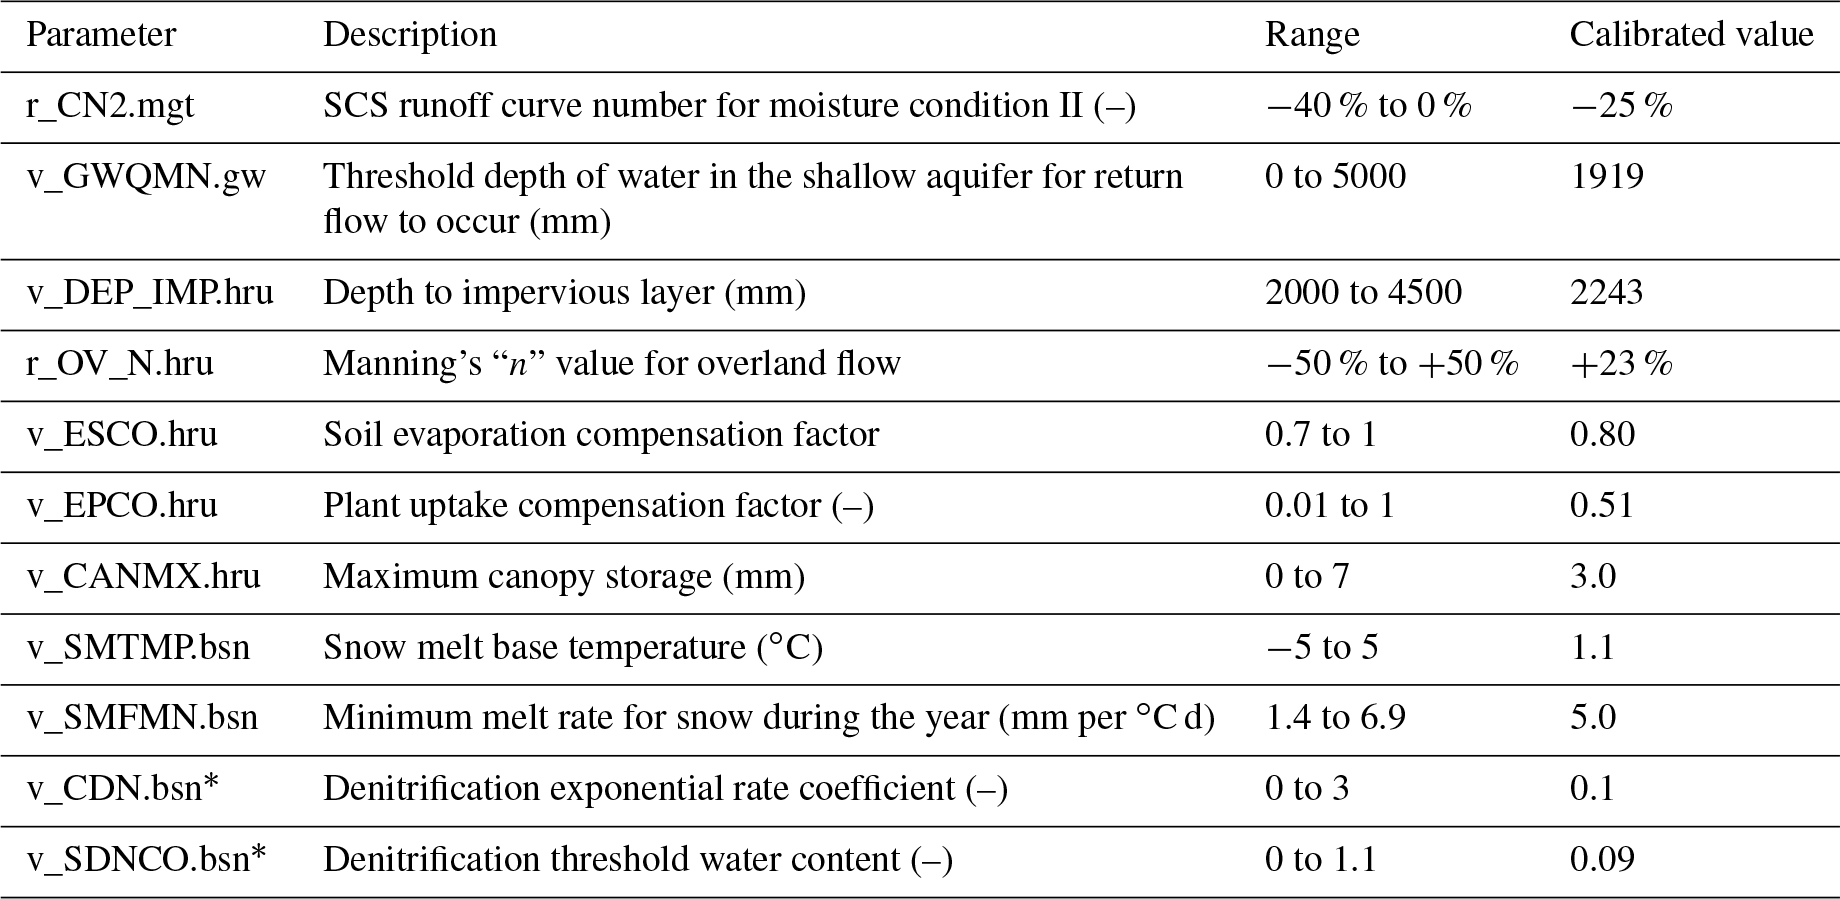
* These parameters were used to calibrate -N loadings.
Table 3Default and calibrated plant parameters. BIO_E Plant radiation use efficiency for corn (MJ m−2), HVSTI Harvest index (–), CNYLD Nitrogen content in yield (kg N per kg yield).
3.1 Hydrology
The streamflow in our study catchment shows a strong seasonal pattern with discharge peaks during winter and very low flows during summer, at which streamflow almost comes to a halt. The measured streamflow was reproduced very well by SWAT (Fig. 3). This holds true both for the calibration and validation periods. Discharge events were triggered either by melting snow or by heavy rainfall. The magnitude of the main discharge peaks in winter were usually captured satisfactory. The measured low flows during summer were simulated correctly by SWAT. This visual interpretation of the measured and simulated hydrographs is being supported by the performance statistics (Table 4). NSE was satisfactory for both the calibration (0.54) and the validation (0.57) period indicating the ability of the model to reproduce the temporal streamflow dynamics correctly. PBIAS with satisfactory values for the calibration (12.1) and validation (14.4) indicates the model's ability in simulating the discharge sum for the entire simulation period properly. The positive PBIAS values indicate a slight underestimation of the measured discharge. Generally, the model performance was similar compared to other studies performed in the same catchment (Bauwe et al., 2016, 2017).
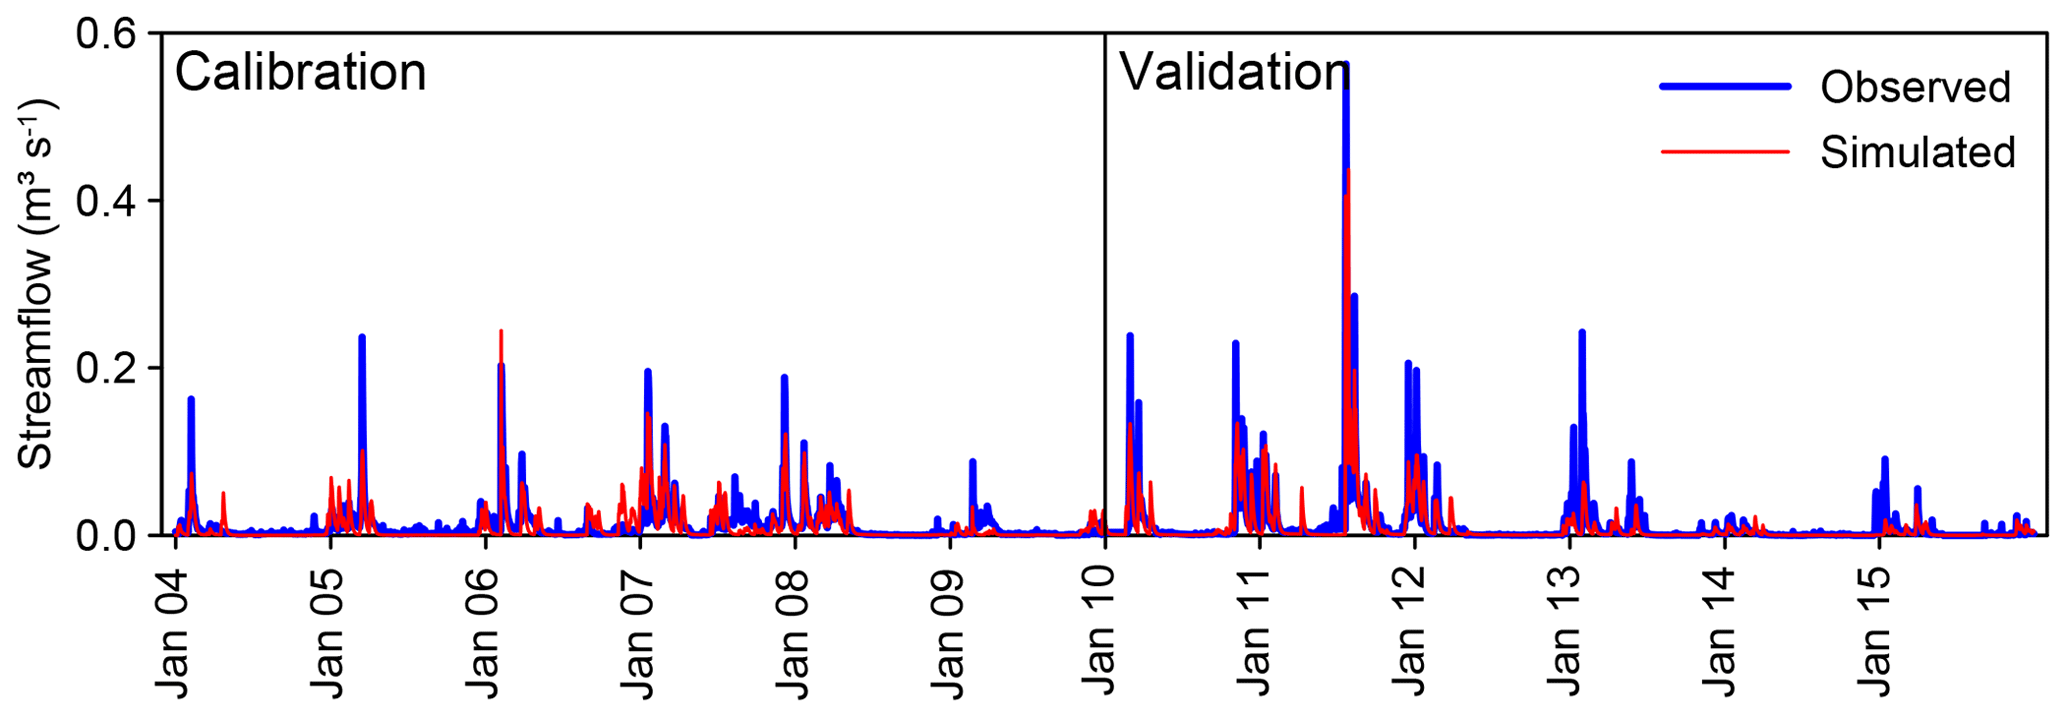
Figure 3Observed and simulated hydrographs at a daily time scale during the calibration and validation period.
3.2 Nitrate
The magnitudes and dynamics of -N loadings over time corresponded roughly with the shape of the hydrograph. This behavior was not surprising, since -N loads arise from the multiplication of streamflow and -N concentration. The consequence is a major loss of -N in winter, while losses in summer are marginal (Fig. 4). Generally, the temporal dynamics of -N loadings were reproduced correctly. However, it is striking that major -N peaks were not captured adequately by SWAT. Two reasons may explain this model behavior. (1) Due to the dependency of -N loadings on streamflow, -N loadings were underestimated when streamflow was underestimated. This was for example the case in March 2005, when measured streamflow was 0.24 m3 s−1, while SWAT only simulated 0.1 m3 s−1 (Fig. 3). Consequently, observed -N loadings were much higher compared to the simulated ones during that time (Fig. 4). (2) Although simulated -N concentrations reflected the actual field conditions surprisingly well, -N concentrations were not always adequately portrayed by SWAT during discharge events (Fig. 5). This was for example the case for a discharge event in January 2007, when maximum losses of 1.5 kg -N d−1 were observed, while SWAT only simulated 0.3 kg -N d−1. During that time, -N concentrations in the ditch have risen up to 28 mg L−1, while SWAT calculated only 8 mg -N L−1 (Fig. 5). These differences in -N concentrations were also the reason for underestimating -N loadings in November 2010, when -N concentrations of 19 mg L−1 were measured, while SWAT simulated only 7 mg L−1. A strong increase in -N concentrations during high flow rates in this catchment has already been thoroughly described by Tiemeyer et al. (2006). Apparently, SWAT was not able to simulate the underlying processes in this tile-drained catchment that led to a sharp rise in -N concentrations during discharge events that usually last only a few days. Due to these reasons, performance statistics were lower compared to streamflow. NSE reached a satisfactory value (0.31) for the calibration period and a good value (0.42) for the validation period. Due to the underestimation of -N peaks, PBIAS was positive and reached a very good value during calibration (13.7) and a satisfactory value during validation (20.2).

Figure 4Observed and simulated -N loadings at a daily time scale during the calibration and validation period.
Table 4Daily model performances with regard to streamflow and -N loadings during the calibration (2004–2009) and validation period (2010–2015). NSE Nash-Sutcliffe Efficiency, PBIAS Percentage bias.

a Satisfactory, b good, c very good (according to performance ratings put forward by Moriasi et al., 2015).
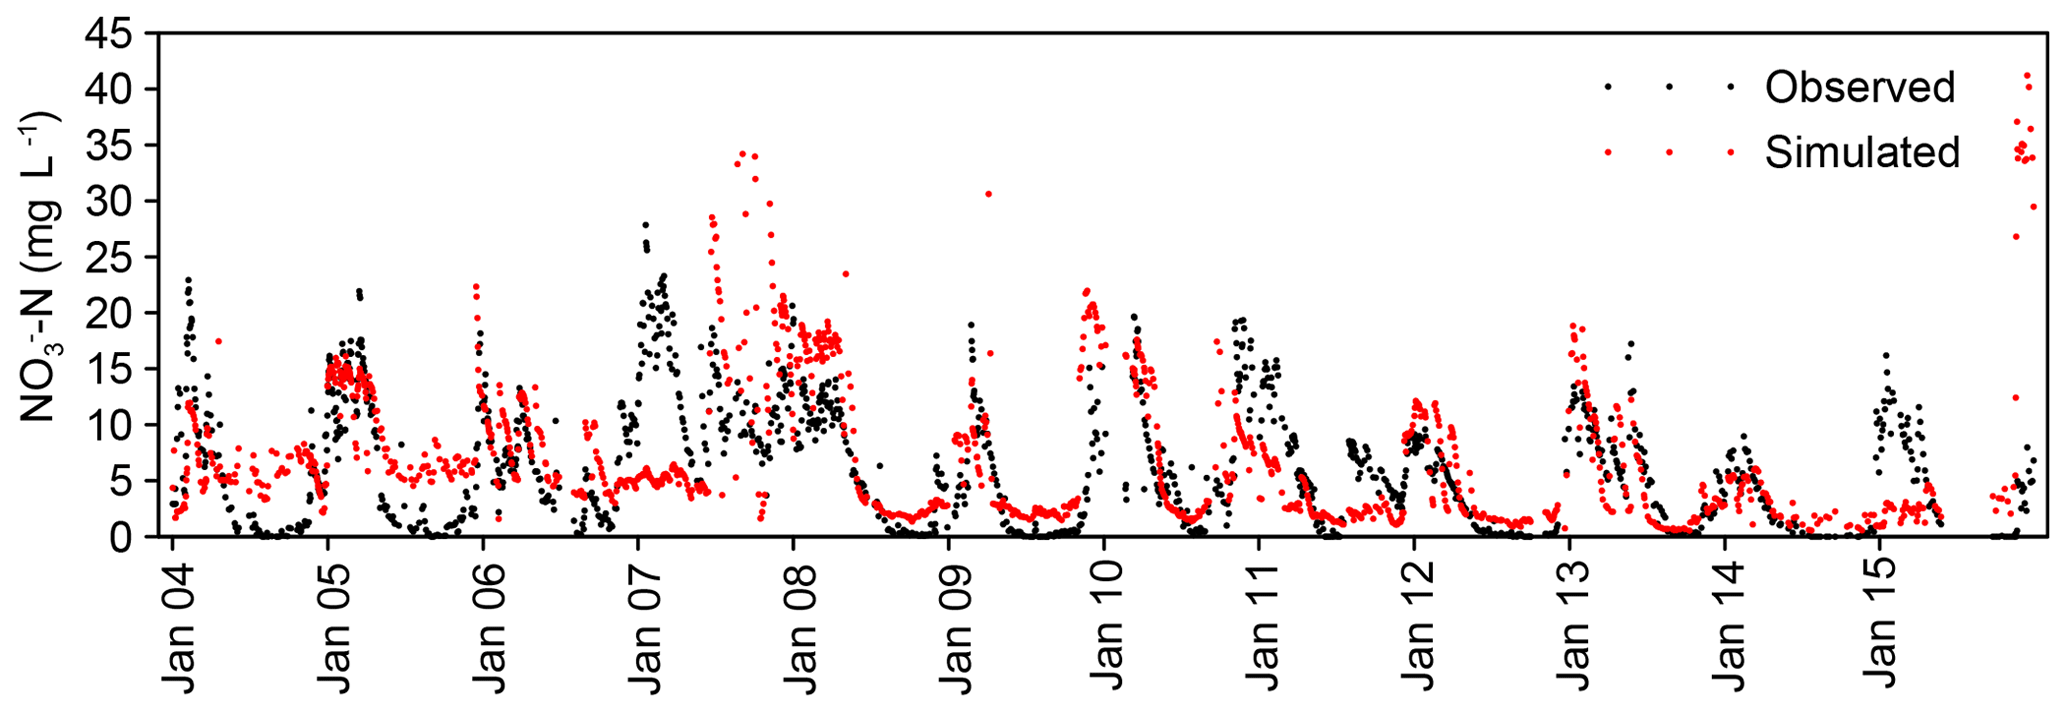
Figure 5Observed and simulated -N concentrations at a daily time scale for the entire study period.
3.3 Crop yield
Simulated crop yields were similar to observed values (Fig. 6). Simulated average yields for winter wheat (7730 kg ha−1), rapeseed (4221 kg ha−1), and maize silage (14 023 kg ha−1) fitted very well to the observed values with a deviation of +3 %, −3 %, and −2 %, respectively. Simulated yield for winter barley (6941 kg ha−1) was 13 % lower compared to the measured value. The best fit regarding the range of yields was achieved for winter wheat. For the three other crops, the temporal variation of measured yield was lower compared to the simulated values, which was most apparent for maize silage.
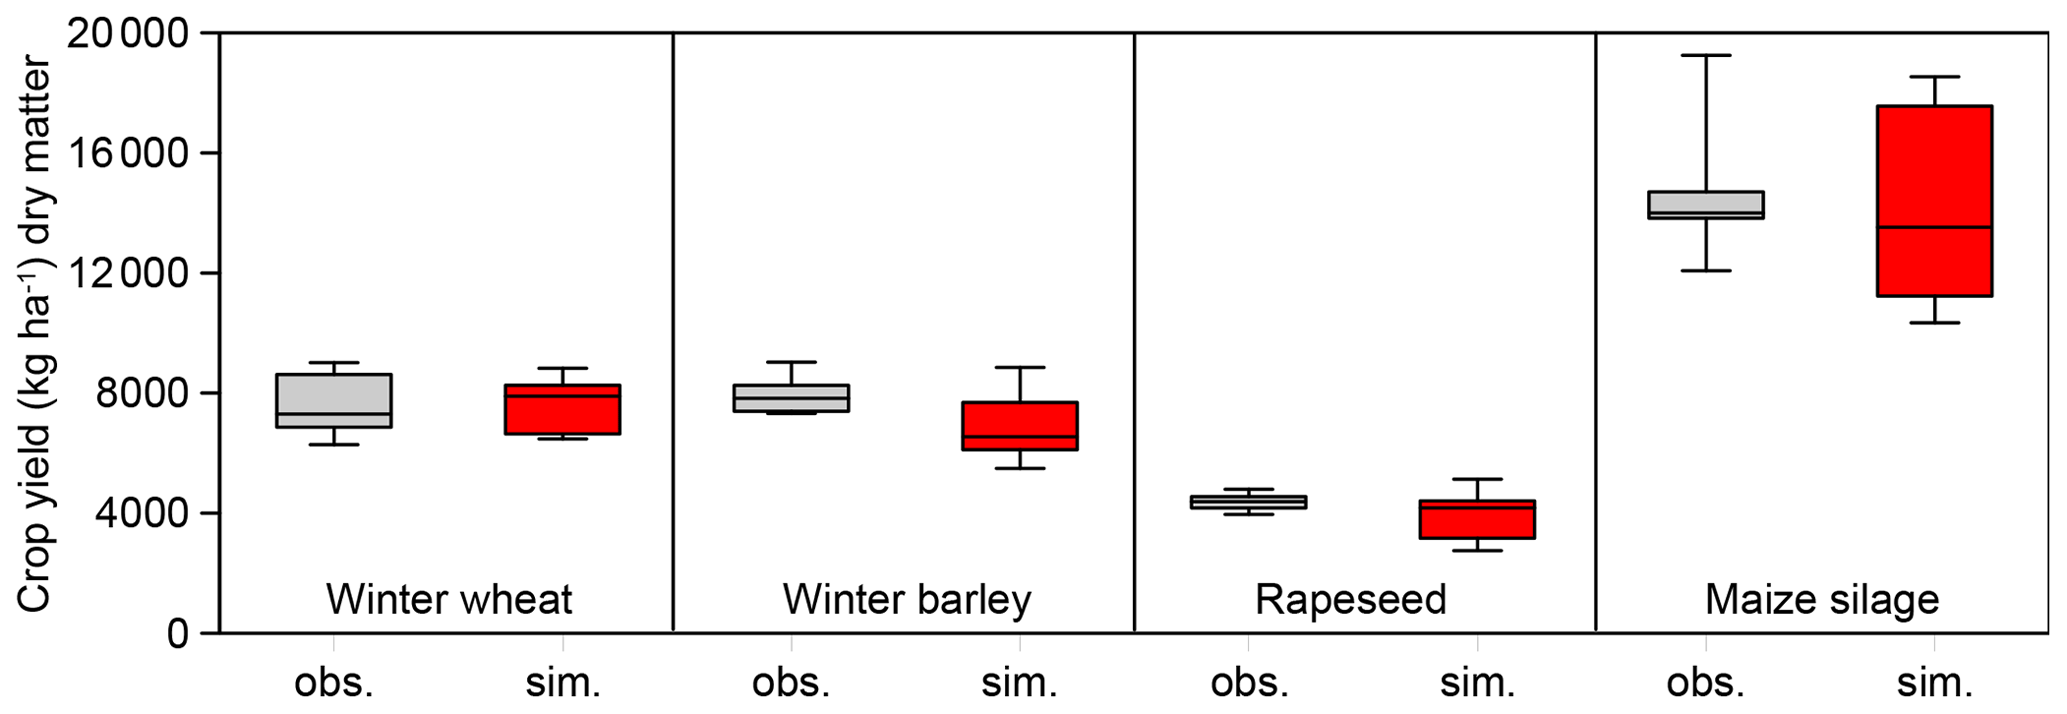
Figure 6Boxplots of measured (obs.) and simulated (sim.) crop yields for winter wheat, winter barley, rapeseed, and maize silage covering the entire simulation period 2004–2015.
In comparison to streamflow or nitrate, it was more challenging to capture high or low yield years with SWAT. For all major crops, there was no relationship between measured and simulated crop yields (Fig. 7). On the contrary, it appears that higher measured yields for winter barley correspond with lower simulated yields. The difficulties in capturing temporal variations of crop yield have been described for example in Srinivasan et al. (2010). The researchers compared measured and simulated corn and soybean yields and predicted the yields averaged over ten years well. Nevertheless, SWAT failed to capture the temporal variation in crop yields, which was explained with lacking information on management practices at farm level (Srinivasan et al., 2010). This reason is ruled out for our very small study catchment, since we defined exactly the management conditions prevailing on the fields in the model. We rather assume that the relationships and interactions of biotic and abiotic factors influencing plant growth are too complex to being portrayed exactly in SWAT equations. However, there are a few examples in the literature, in which simulated temporal variations of crop yields (corn, soybean) were simulated fairly well (Hu et al., 2007; Nair et al., 2011).
Our data show that the temporal variation in crop yield is usually smaller for actual yield compared to simulated yield (Figs. 6, 7). That gives the impression that plant growth in SWAT is more “weather-sensitive” than in the field. This model behavior seems to be valid also for other regions and crops. For example, large simulated yield reductions for corn and soybean due to drought stress that were not supported by the yield statistics are reported by Guo et al. (2018). It has also been argued that the impact of soil drought on plant growth and in the following on crop yield might be overestimated by SWAT (Sinnathamby et al., 2017).

Figure 7Relationships between measured and simulated crop yields for winter wheat, winter barley, rapeseed, and maize silage.
3.4 Reduction of N fertilization
Based on the calibrated SWAT model, N fertilizer rates were reduced in 10 % steps in order to analyze the effect on crop yields and NO3-N loadings (Fig. 8). Generally, yields decreased with decreasing N fertilizer rates for all four crops. When N fertilization was completely dispensed with, crop yields were in the range from 10 % to 20 % of the reference conditions. The reduction of N fertilizer rates had a tremendous effect on -N loadings. A moderate 10 % reduction of N Input led to a 24 % reduction of -N loadings at the catchment outlet. If N fertilizer rates were reduced by 50 %, -N loadings only amounted to 30 % compared to the reference condition.
Optimized N fertilization that considers both economic and environmental aspects can be estimated by displaying the crop yields and -N loadings in one diagram (Fig. 8). In this sense, optimum N fertilization is achieved when the distance between the “yield curve” and the “-N loading curve” is greatest. This point is crop-dependent and is located between 50 (winter wheat, rapeseed, maize silage) and 70 % (winter barley) of the actual N fertilization. If this optimized fertilization strategy would be applied, the -N loadings would only amount to between 30 % and 44 % of the reference condition, which corresponds to a drastic reduction. At the same time, the yield reductions would be moderate ranging from 12 % (rapeseed, maize silage) to 21 % (winter wheat) compared to the reference condition.
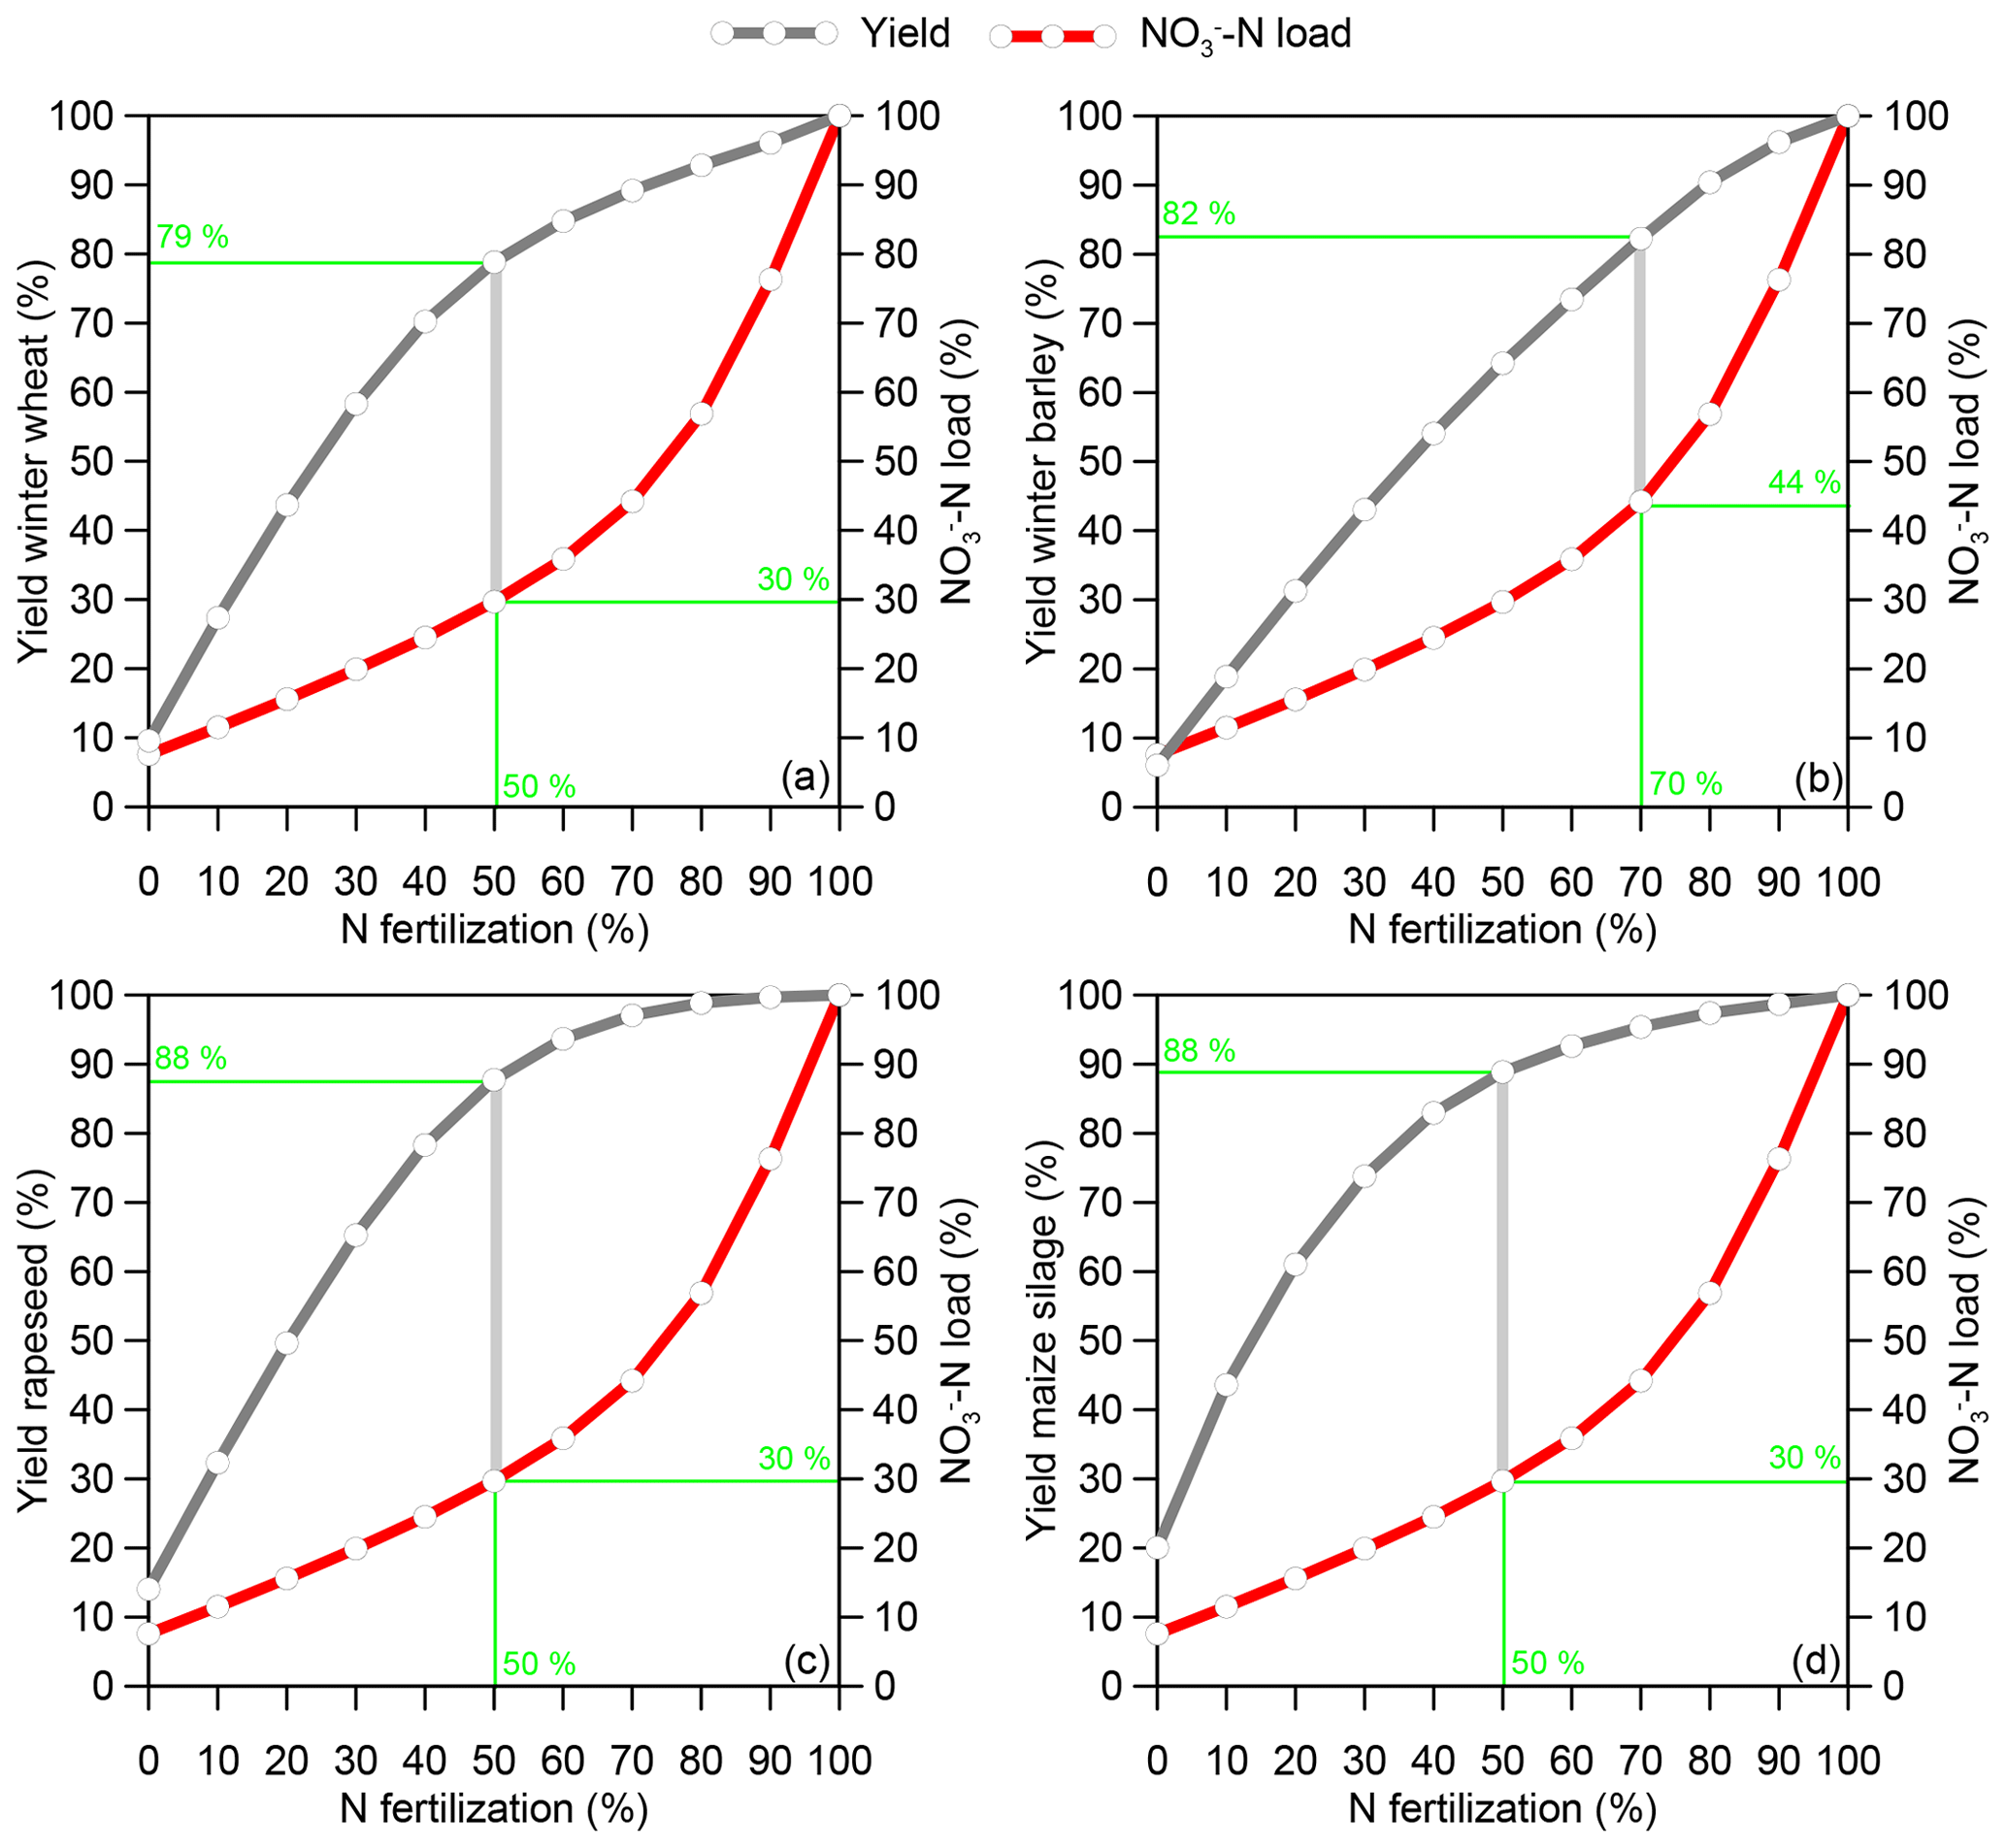
Figure 8Crop yield and -N loadings as functions of N fertilization given as percentages. The gray lines indicate the largest difference between crop yield and NO3-N loadings. 100 % correspond to the actual conditions.
Our scenario analysis shows general trends of the effects resulting from reduced N fertilizer rates on crop yield and on -N loadings, but conditions on the field are much more complex. Optimum N fertilizer rates that both guarantee high yields and minimize negative environmental impacts such as leaching may vary within the same field due to the heterogeneity of soil properties. In addition, they depend on inter- and intra-annual weather patterns (Basso et al., 2012). However, our modeling results indicating a slight decrease of N fertilizer rates leading to moderate reductions in crop yield but significant reductions in N losses are consistent with other studies. For example, Wang et al. (2017) reported on slightly reduced N application rates while keeping the wheat yield nearly constant but reducing significantly the leaching rates in north China. A worldwide meta-analysis comprising a large number of European studies (Sweden, Germany, Spain, Italy, UK, and Denmark) has revealed that lowest yield-scaled leaching losses were observed with slightly suboptimal N fertilization rates that corresponded to 90 % and 96 % of maximum maize and wheat yields, respectively (Zhou and Butterbach-Bahl, 2014).
Due to the simplifications that are inherent for crop models and eco-hydrological models like SWAT, practical field experiments at catchment level are needed in order to underpin the results of simulation studies. The combined assessment of optimized N management strategies due to scenario analyses performed with simulation models and experiments conducted at farm scale could help practitioners to operate according to a both economically and environmentally optimal N management.
The SWAT model predicted streamflow and nitrate loads satisfactory in a very small catchment < 1 km2. This calibrated model formed the basis for the assessment of the effects of different N fertilization on surface water quality and crop yield. Based on the results of the study the following conclusions can be drawn: A good model performance regarding streamflow is the precondition for predicting nitrate losses and crop yields correctly. With a proper parameterization of plant parameters, it should be feasible for modelers to reproduce the average crop yield over time. Simulating the inter-annual variations of crop yields with SWAT remains challenging due to inherent model simplifications. We assume that the heat unit concept that governs plant growth in SWAT may be too simplistic to reflect the manifold factors influencing plant growth, in particular at a small spatial scale.
A scenario analysis revealed that already a moderate reduction of N fertilization might reduce NO3-N losses in surface waters notably, while keeping the crop yield on a high level. To underpin these results, we strongly recommend the establishment of test catchments. Long-term investigations in such areas under real world conditions could help to further optimizing N management that ensures high crop yields while simultaneously minimizes NO3-N losses in surface waters.
Land management data provided by the farmer are not publicly accessible. Meteorological, hydrological and nitrate data were collected by our working group during intensive fieldwork in the last 15 years. These data are not publicly accessible but can be provided upon request. The SWAT model including source code can be downloaded from: https://swat.tamu.edu/ (last access: 3 April 2019).
AB designed the study and did the modeling work. PK collected most of the data. AB wrote the article with input from PK and BL. BL finalized the manuscript. All authors read and approved the final manuscript.
The authors declare that they have no conflict of interest.
This article is part of the special issue “Innovative monitoring techniques and modelling approaches for analysing hydrological processes in small basins”. It is a result of the 17th Biennial Conference ERB 2018, Darmstadt, Germany, 11–14 September 2018.
We are grateful to Bärbel Tiemeyer for her extensive fieldwork over a period of 10 years and her preparation of discharge and meteorological data. In addition, we would like to thank Tilo Hartwig and Marianne Kietzmann for their assistance with the field and laboratory work throughout the study period.
This paper was edited by Britta Schmalz and reviewed by two anonymous referees.
Abbaspour, K. C.: SWAT-CUP: SWAT calibration and uncertainty programs – a user manual, Eawag: Swiss Federal Institute of Aquatic Science and Technology, Duebendorf, Switzerland, available at: http://swat.tamu.edu/media/114860/usermanual_swatcup.pdf (last access: 2 October 2018), 2014.
Abbaspour, K. C., Rouholahnejad, E., Vaghefi, S., Srinivasan, R., Yang, H., and Kløve, B.: A continental-scale hydrology and water quality model for Europe: Calibration and uncertainty of a high-resolution large-scale SWAT model, J. Hydrol., 524, 733–752, https://doi.org/10.1016/j.jhydrol.2015.03.027, 2015.
Arnold, J. G., Srinivasan, R., Muttiah, R. S., and Williams, J. R.: Large area hydrologic modeling and assessment part I: model development, J. Am. Water Resour. As., 34, 73–89, https://doi.org/10.1111/j.1752-1688.1998.tb05961.x, 1998.
Basso, B., Sartori, L., Cammarano, D., Fiorentino, C., Grace, P. R., Fountas, S., and Sorensen, C. A.: Environmental and economic evaluation of N fertilizer rates in a maize crop in Italy: A spatial and temporal analysis using crop models, Biosyst. Eng., 113, 103–111, https://doi.org/10.1016/j.biosystemseng.2012.06.012, 2012.
Bauwe, A., Kahle, P., and Lennartz, B.: Hydrologic Evaluation of the Curve Number and Green and Ampt Infiltration Methods by Applying Hooghoudt and Kirkham Tile Drain Equations Using SWAT, J. Hydrol., 537, 311–321, https://doi.org/10.1016/j.jhydrol.2016.03.054, 2016.
Bauwe, A., Tiedemann, S., Kahle, P., and Lennartz, B.: Does the Temporal Resolution of Precipitation Input Influence the Simulated Hydrological Components Employing the SWAT Model?, J. Am. Water Resour. As., 53, 997–1007, https://doi.org/10.1111/1752-1688.12560, 2017.
BMUB: Nitratbericht 2016, Bundesministerien für Umwelt, Naturschutz, Bau und Reaktorsicherheit und Bundesministerium für Ernährung und Landwirtschaft, Bonn, Deutschland, available at: https://www.bmu.de/fileadmin/Daten_ BMU/Download_PDF/Binnengewaesser/nitratbericht_2016_bf.pdf (last access: 2 October 2018), 2017.
Di, H. J. and Cameron, K. C.: Nitrate leaching in temperate agroecosystems: Sources, factors and mitigating strategies, Nutr. Cycl. Agroecosys., 64, 237–256, https://doi.org/10.1023/A:1021471531188, 2002.
Diacono, M., Rubino, P., and Montemurro, F.: Precision nitrogen management of wheat. A review, Agron. Sustain. Dev., 33, 219–241, https://doi.org/10.1007/s13593-012-0111-z, 2013.
European Parliament and European Council: Directive 2000/60/EC of the European Parliament and of the Council of October 2000 Establishing a Framework for Community Action in the Field of Water Policy, Official Journal of the European Communities, L327, 1–73, 2000.
Gassman, P. W., Reyes, M. R., Green, C. H., and Arnold, J. G.: The Soil and Water Assessment Tool: historical development, applications, and future research directions, T. ASABE, 50, 1211–1250, 2007.
Guo, T., Cibin, R., Chaubey, I., Gitau, M., Arnold, J. G., Srinivasan, R., Kiniry, J. R., and Engel, B. A.: Evaluation of bioenergy crop growth and the impacts of bioenergy crops on streamflow, tile drain flow and nutrient losses in an extensively tile-drained watershed using SWAT, Sci. Total Environ., 613–614, 724–735, https://doi.org/10.1016/j.scitotenv.2017.09.148, 2018.
Hu, X., McIsaac, G. F., David, M. B., and Louwers, C. A. L.: Modeling riverine nitrate export from an east-central Illinois watershed using SWAT, J. Environ. Qual., 36, 996–1005, https://doi.org/10.2134/jeq2006.0228, 2007.
Kahle, P., Bauwe, A., and Lennartz, B.: Overview about investigations on nutrient losses in the tile-drained lowland catchment Zarnow (Mecklenburg-Western Pomerania), Hydrol. Wasserbewirts., 62, 159–172, https://doi.org/10.5675/HyWa_20183_3, 2018.
Lawlor, P. A., Helmers, M. J., Baker, J. L., Melvin, S. W., and Lemke, D. W.: Nitrogen application rate effect on nitrate-nitrogen concentration and loss in subsurface drainage for a corn-soybean rotation, T. ASABE, 51, 83–94, 2008.
Liang, H., Qi, Z., Hu, K., Li, B., and Prasher, S. O.: Modelling subsurface drainage and nitrogen losses from artificially drained cropland using coupled DRAINMOD and WHCNS models, Agr. Water Manage., 195, 201–210, https://doi.org/10.1016/j.agwat.2017.10.011, 2018.
LUNG-MV: Konzeptbodenkarte 1:25 000, State Agency for the Environment, Nature Conservation and Geology of Mecklenburg-Western Pomerania, Güstrow, Germany, 2010.
LVA M-V: Digital Elevation Model grid size 25×25 m, Land survey office Mecklenburg-Western Pomerania, Schwerin, Germany, 2000.
Maier, N. and Dietrich, J.: Using SWAT for Strategic Planning of Basin Scale Irrigation Control Policies: a Case Study from a Humid Region in Northern Germany, Water Resour. Manage., 30, 3285–3298, https://doi.org/10.1007/s11269-016-1348-0, 2016.
Malagó, A., Bouraoui, F., Vigiak, O., Grizzetti, B., and Pastori, M.: Modelling water and nutrient fluxes in the Danube River Basin with SWAT, Sci. Total Environ., 603–604, 196–218, https://doi.org/10.1016/j.scitotenv.2017.05.242, 2017.
Moriasi, D., Pai, N., and Daggupati, P.: Hydrologic and water quality models: Performance measures and evaluation criteria, T. ASABE, 58, 1763–1785, https://doi.org/10.13031/trans.58.10715, 2015.
Nair, S. S., King, K. W., Witter, J. D., Sohngen, B. L., and Fausey, N. R.: Importance of crop yield in calibrating watershed water quality simulation tools, J. Am. Water Resour. As., 47, 1285–1297, https://doi.org/10.1111/j.1752-1688.2011.00570.x, 2011.
Neitsch, S. L., Arnold, J. G., Kiniry, J. R., and Williams, J. R.: Soil and Water Assessment Tool: theoretical documentation, Texas Water Resources Institute Technical Report No. 406, Temple, USA, 2011.
Sinnathamby, S., Douglas-Mankin, K. R., and Craige, C.: Field-scale calibration of crop-yield parameters in the Soil and Water Assessment Tool (SWAT), Agr. Water Manage., 180, 61–69, https://doi.org/10.1016/j.agwat.2016.10.024, 2017.
Srinivasan, R., Zhang, X., and Arnold, J.: SWAT ungauged: Hydrological budget and crop yield predictions in the upper Mississippi River basin, T. ASABE, 53, 1533–1546, 2010.
Tiemeyer, B., Kahle, P., and Lennartz, B.: Nutrient losses from artificially drained catchments in North-Eastern Germany at different scales, Agr. Water Manage., 85, 47–57, https://doi.org/10.1016/j.agwat.2006.03.016, 2006.
van Grinsven, H. J. M., ten Berge, H. F. M., Dalgaard, T., Fraters, B., Durand, P., Hart, A., Hofman, G., Jacobsen, B. H., Lalor, S. T. J., Lesschen, J. P., Osterburg, B., Richards, K. G., Techen, A.-K., Vertés, F., Webb, J., and Willems, W. J.: Management, regulation and environmental impacts of nitrogen fertilization in northwestern Europe under the Nitrates Directive; a benchmark study, Biogeosciences, 9, 5143–5160, https://doi.org/10.5194/bg-9-5143-2012, 2012.
Wang, H., Zhang, Y., Chen, A., Liu, H., Zhai, L., Lei, B., and Ren, T.: An optimal regional nitrogen application threshold for wheat in the North China Plain considering yield and environmental effects, Field Crop Res., 207, 52–61, https://doi.org/10.1016/j.fcr.2017.03.002, 2017.
Zhou, M. and Butterbach-Bahl, K.: Assessment of nitrate leaching loss on a yield-scaled basis from maize and wheat cropping systems, Plant Soil, 374, 977–991, https://doi.org/10.1007/s11104-013-1876-9, 2014.