 | 29 Nov 2018
Accuracy measurement of Random Forests and Linear Regression for mass appraisal models that estimate the prices of residential apartments in Nicosia, Cyprus
Thomas Dimopoulos
Hristos Tyralis
Nikolaos P. Bakas
Diofantos Hadjimitsis
The purpose of this article is to examine the prediction accuracy of the Random Forests, a machine learning method, when it is applied for residential mass appraisals in the city of Nicosia, Cyprus. The analysis is performed using transaction sales data from the Cyprus Department of Lands and Surveys, the Consumer Price Index of Cyprus from the Cyprus Statistical Service and the Central Bank of Cyprus' Residential Index (Price index for apartments). The Consumer Price Index and the price index for apartments record quarterly price changes, while the dependent variables for the computational models were the Declared and the Accepted Prices that were conditional on observed values of a variety of independent variables. The Random Forests method exhibited enhanced prediction accuracy, especially for the models that comprised of a sufficient number of independent variables, indicating the method as prominent, although it has not yet been utilized adequately for mass appraisals.
Please read the corrigendum first before continuing.
-
Notice on corrigendum
The requested paper has a corresponding corrigendum published. Please read the corrigendum first before downloading the article.
-
Article
(1729 KB)
- Corrigendum
-
Supplement
(603 KB)
-
The requested paper has a corresponding corrigendum published. Please read the corrigendum first before downloading the article.
- Article
(1729 KB) - Corrigendum
-
Supplement
(603 KB) - BibTeX
- EndNote


The Random Forests (RF) method is broadly used for predictive modeling as well as for data analysis and has been deemed significant in a wide variety of scientific thematic areas, such as Computer Science (Data Mining), Engineering, Medicine, Business etc. The method is based on the so-called decision trees, which is a machine learning method for classification and regression. More specifically, decision trees are algorithmic structures that consist of nodes and branches. At each node, a decision is made, whether a variable is higher or lower than a value. The nodes lead to branches, which in turn lead to another node, with a sequential decision established each time. Through an iterative procedure, the model is trained to predict the desired output (dependent variable) with the minimum possible errors. In general, the method exhibits high accuracy, however, many times it overfits the training data and as a consequence makes it unable to generalize the predictions. In 2001 the Random Forests was introduced by Breiman, in order to utilize a vast group of different decision trees creating a final result that is an average of the particular trees. This procedure resulted in high prediction performance (accuracy), as well as the significance of each input variable, which is estimated automatically, regarding its contribution to the prediction errors.
A search in Scopus database (2018), for the terms “random forests” and “mass appraisal” existing in the Title, Abstract or Keywords of a paper, returned only two results: Antipov and Pokryshevskaya (2012), and Pokryshevskaya and Antipov (2011). In the first article, that was cited most (23 times), the authors declared that they investigated the performance of a variety of methods such as multiple regression analysis, artificial neural networks and others for the mass appraisal of residential apartments, but that the Random Forests method exhibited higher prediction accuracy. However, a search query in Scopus for the term “random forests” only, existing in the Title, Abstract or Keywords, resulted in 16 655 papers with the first one (Breiman, 2001) being cited 22 498 times. Furthermore, an “inversed” search in Scopus database, only for the term “regression” in the Title, Abstract or Keywords of a paper, Scopus yields 1 158 892 results, while the most frequently used one, in terms of citations, is again the RF method by Breiman (2001).
A variety of regression methods have been utilized in research papers regarding mass appraisals such as in the works of Benjamin et al. (2004) with multiple regression, Liu et al. (2011) with Neural Networks and Dimopoulos and Moulas (2016), with geographically weighted regression. A detailed search was performed in Scopus, utilizing the keyword Real Estate into the first part of the query, together with Mass Appraisal and Property Valuation, with OR statement among them. Through this search, Scopus yielded 935 research documents, with the top ten keywords being Regression Analysis, Real Estate, Spatial Analysis, Neural Networks, Housing, Costs, Investments, Commerce, Housing Market, and Forecasting, which seemed to be relevant to the field under study. However, a more careful investigation of the titles and abstracts of the most cited papers of the resulting database, exhibited an approximate 30 % of irrelevant papers and another 10 % in the general thematic area of Real Estate, however dealing with Economics, Commercial etc, which are not directly relevant to literature regarding mass appraisals. A variety of transformations of the query were scrutinized, in order to accomplish a formulation of the query that resulted in consistent papers. Accordingly, when the word Hous* (with * indicating any other character, such as ing, e, etc) was incorporated OR the term Real Estate was part of the query, then the resulting (402) documents were relevant to the studied topic. Finally, the keyword Female was also excluded from the database, as, obviously, it was referring to medical or social sciences papers. The structure of the query is demonstrated in Fig. 1.

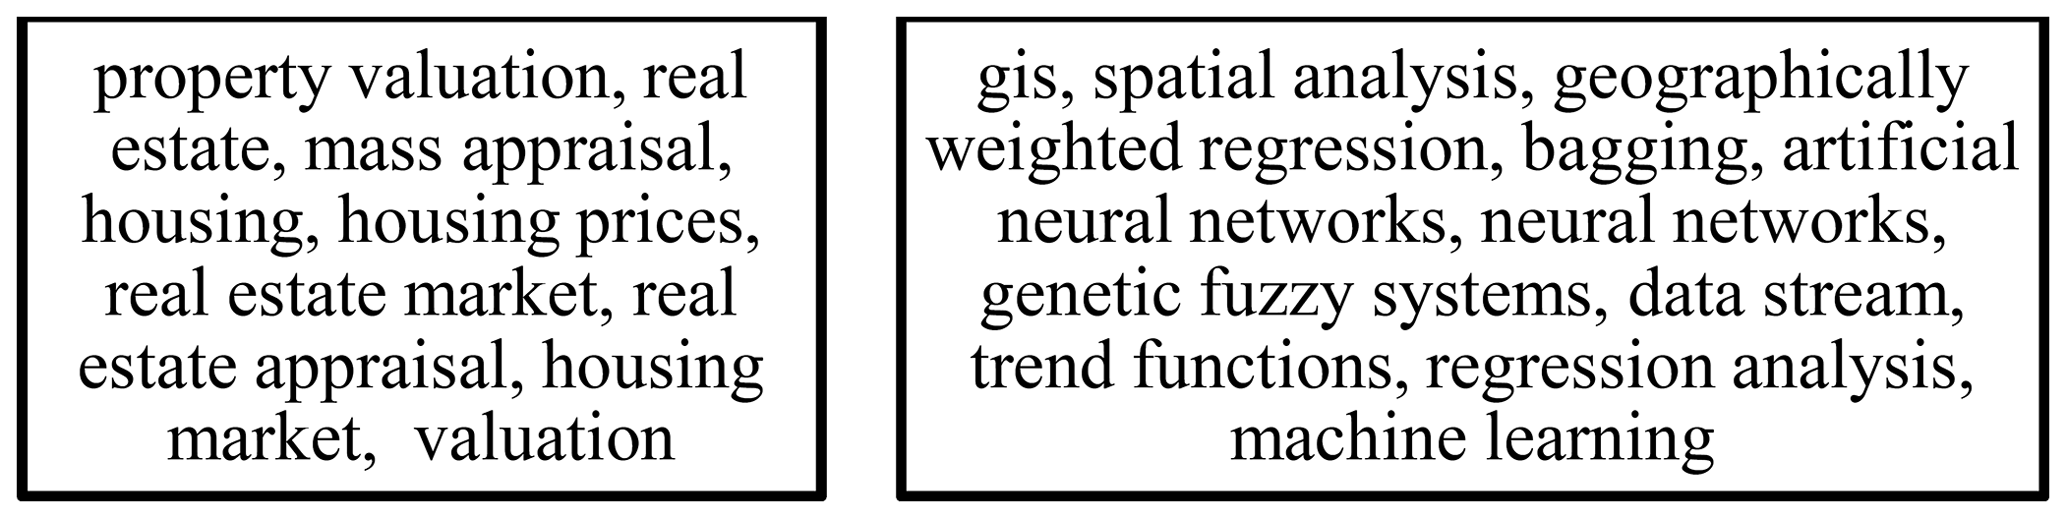
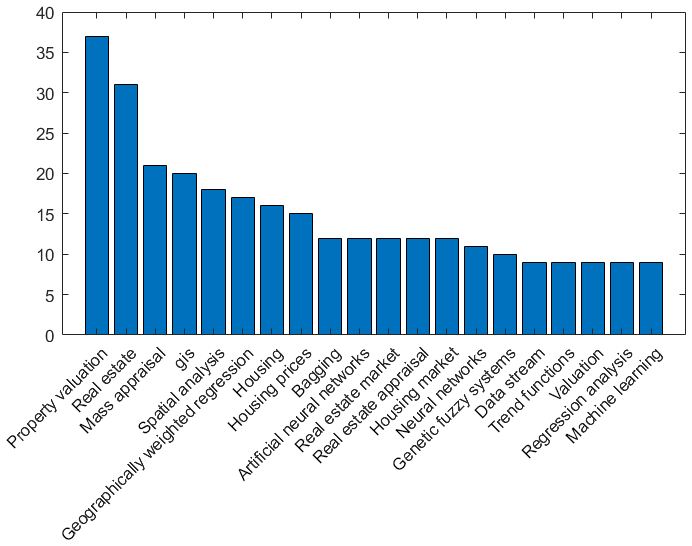
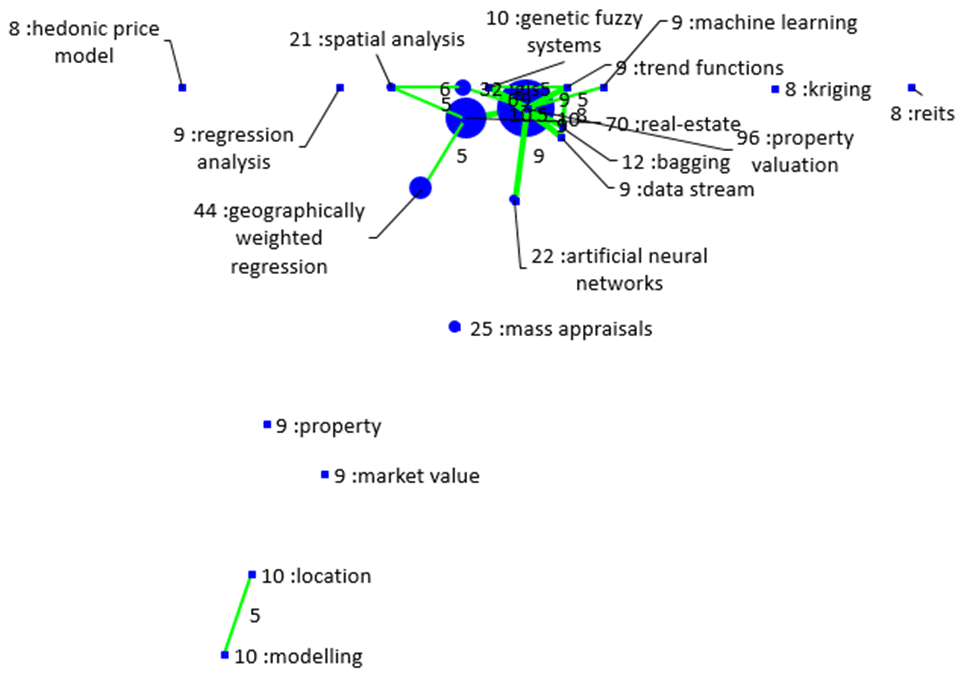
The above-mentioned procedure produced a database with 486 research papers. The papers are relevant to the studied topic and at the same time adequate in terms of size, in order to produce generative conclusions. In Fig. 3, the frequencies of the top twenty keywords, occurred in the Scopus database are demonstrated. The most frequent, were the keywords property valuation, real estate, and mass appraisal, indicating the consistency of the database and the accurate selection of the papers. Accordingly, the top twenty keywords were classified into two categories, the methodological ones (property valuation, real estate, mass appraisal, housing etc.) and some technical/data analysis keywords, such as GIS, spatial analysis, geographically weighted regression, bagging, artificial neural networks, as classified in Fig. 2. Furthermore, as depicted in Fig. 4, for the associations among the most frequent keywords, the Geographically Weighted Regression (Wheeler and Tiefelsdorf, 2005) is the most frequent as well as close to the property Valuations keyword (and thus more times referred simultaneously), while the Random Forests method does not even exist on the bibliometric map (Plevris et al., 2017).
In this paper, the accuracy of linear regression was compared with the accuracy of the Random forest method, in order to investigate the latter's relative performance as a widespread regression method, however with limited publications in the mass appraisals research field. The studied database regards 3527 transactions of residential apartments in Nicosia, obtained from the Department of Lands and Surveys of Cyprus (DLS). The period studied, includes transactions from 2008 to 2014, which regard to Nicosia's district. The database obtained by the DLS, includes a vast amount of sales features. The following variables were excluded: Town village name, Planning zone name, Block, Unit built year, declared price over enclosed extent, declared price over enclosed and covered extent, declared price over total extent, declared price over adjusted extent, accepted price over enclosed extent, accepted price over enclosed and covered extent, accepted price over the total extent, accepted price over adjusted extent, total value 2013 over enclosed extent, total value 2013 over enclosed and covered extent, total value 2013 over total extent, total value 2013 over adjusted extent. The database, contains the sales data, the Consumer Price Index of Cyprus as well as the Central Bank of Cyprus residential index (Flats Index). In Table S5 in the Supplement, the analytical description of the fields in the studied Database is presented.
The following variables were excluded, because most of them contained too many missing values: District, Quarter, Sheet, Parcel no, Access code, Planning zone code, Secondary planning zone code, DLO file, DLO file year, Remark, Main sbp cat, Status, Building code, Building sbpi id no, Unit code, Field46. For the purposes of the study some new variables were created, to improve the forecasting:
-
Dali Municipality and Latsia Municipality concatenated to Dali-Latsia Municipality, due to a low number of observations (transactions).
-
the Unit_condition_mod_code merged class 3 & 4 into one variable (3), as the 4 class had only few observations.
-
The time data were converted to count the difference of days between the built date and the age at the year 2013 and then converted to years, by dividing with 365.25
-
The sale acceptance quarter categorical variable, was converted to numeric, with regard to the month of the year (< = 3 − > “Q1”, < = 6 − > “Q2”, < = 9 − > “Q3”, > = 10 − > “Q4”).
-
Furthermore, a combined variable was created, regarding every apartment's “adjusted” area (AE), utilizing the Unit Enclosed Extent (UEE), the Unit Covered Extent (UCE) and the Unit Uncovered Extent (UUE):
-
Additionally, another variable was created, equal to the accepted price divided by the apartment's adjusted area (AE).
-
The Accepted minus the Declared price was also investigated as the dependent variable. This price is always equal to or bigger than 0, for the above-mentioned reasons.

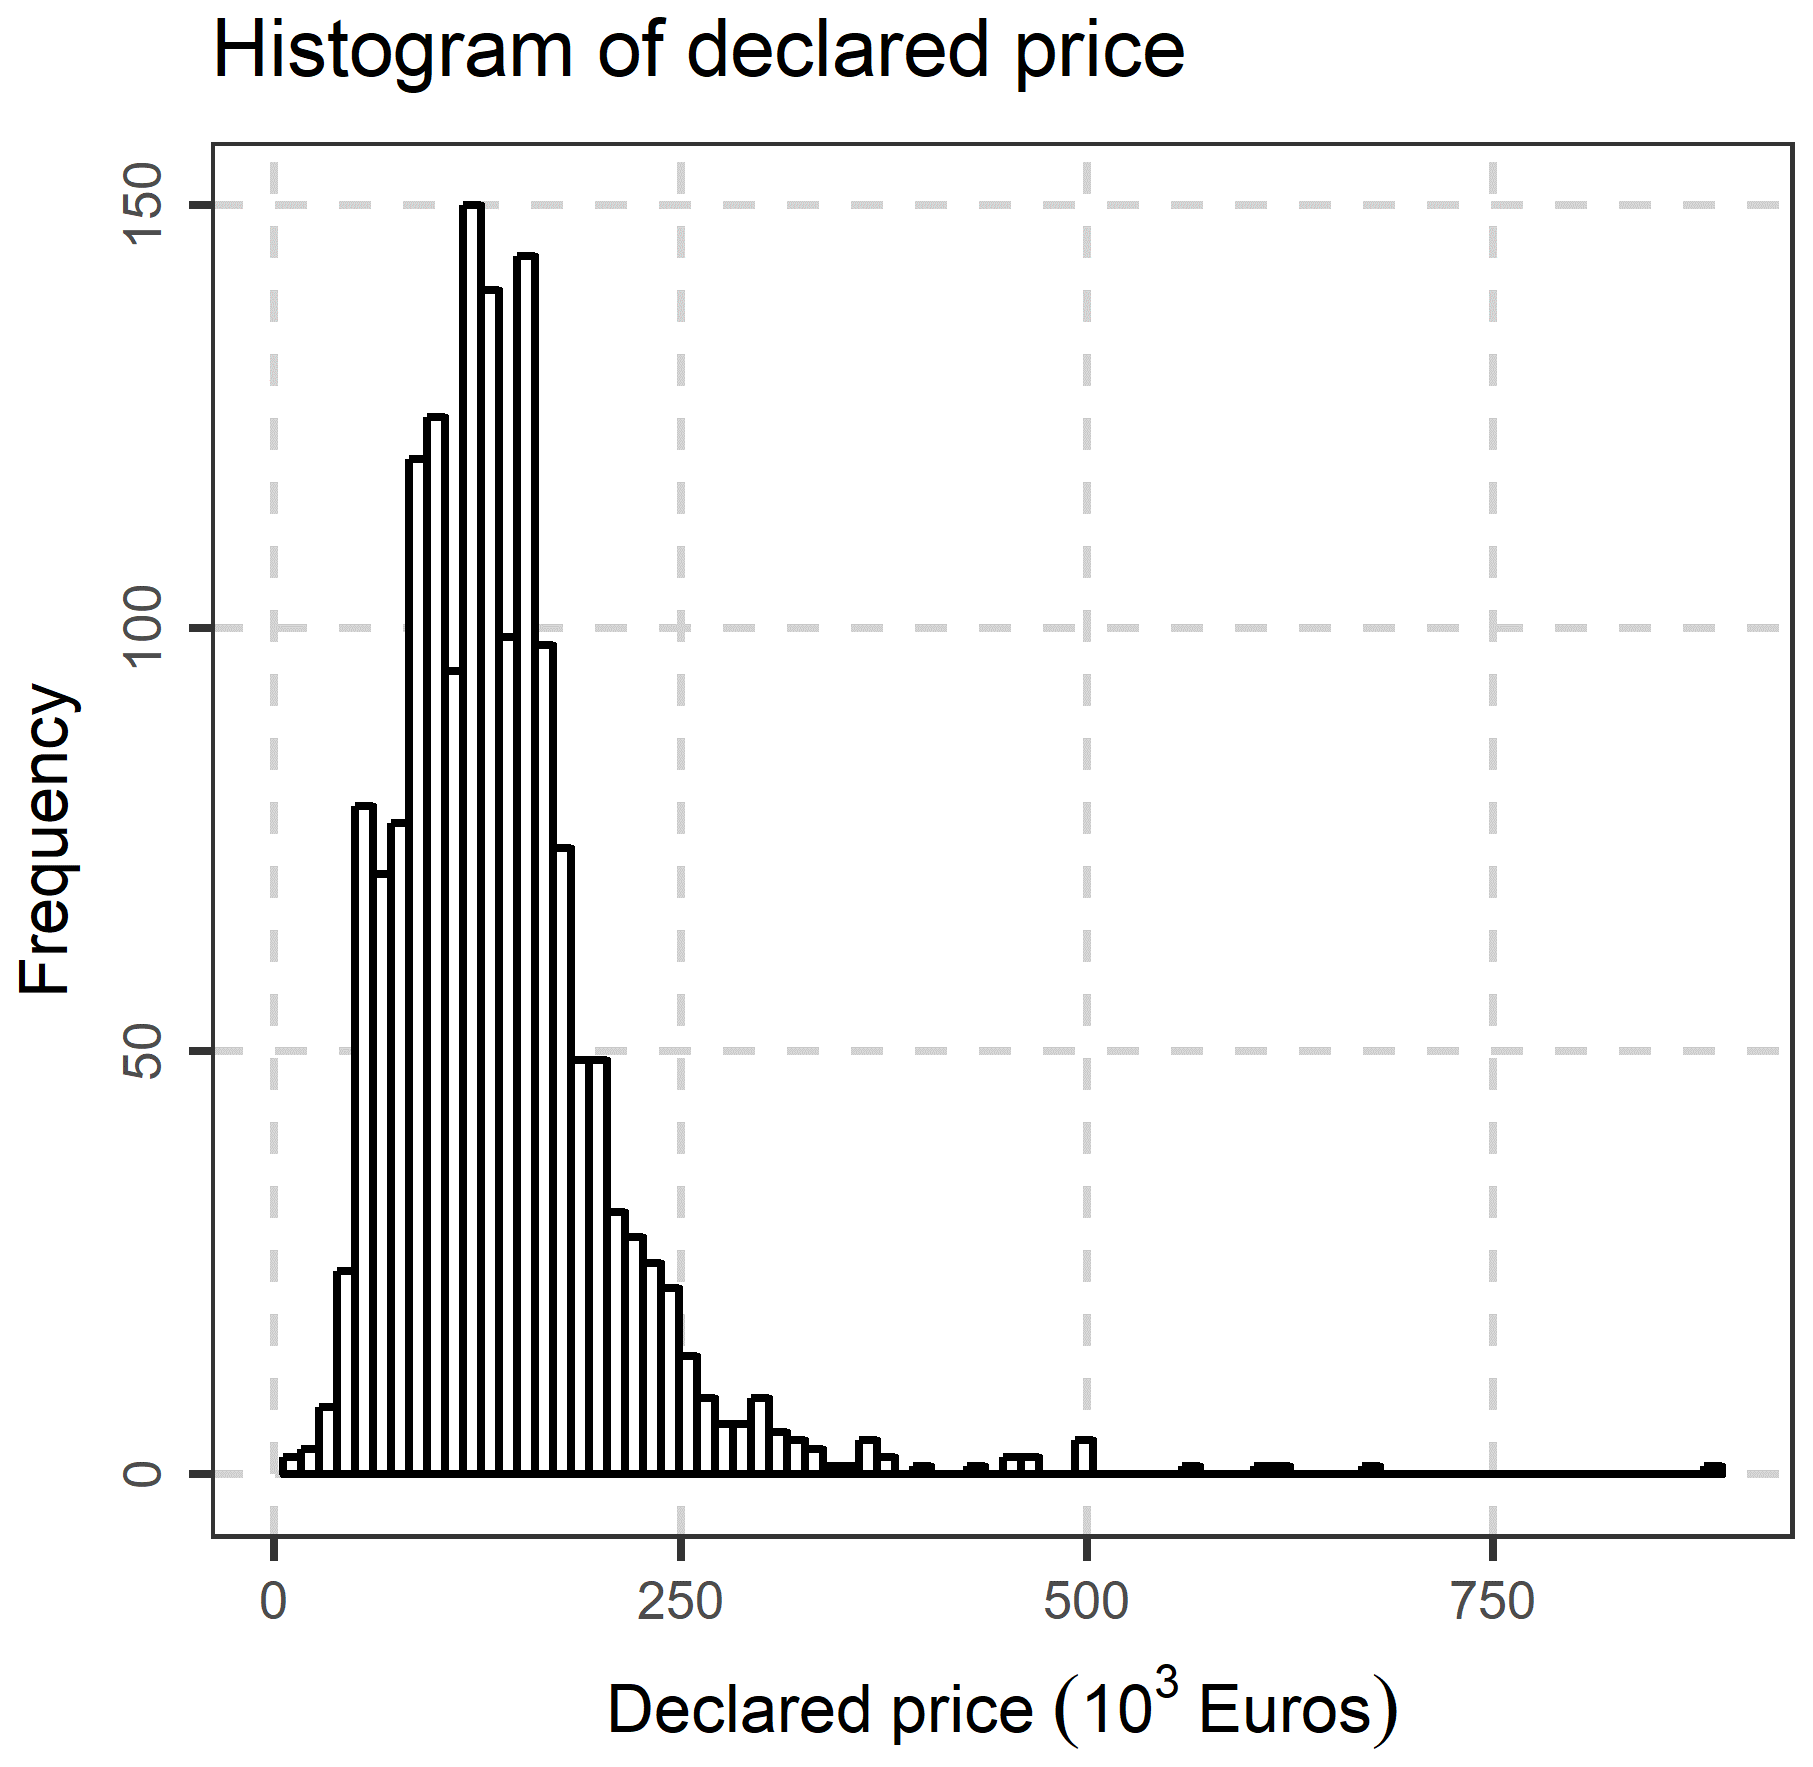
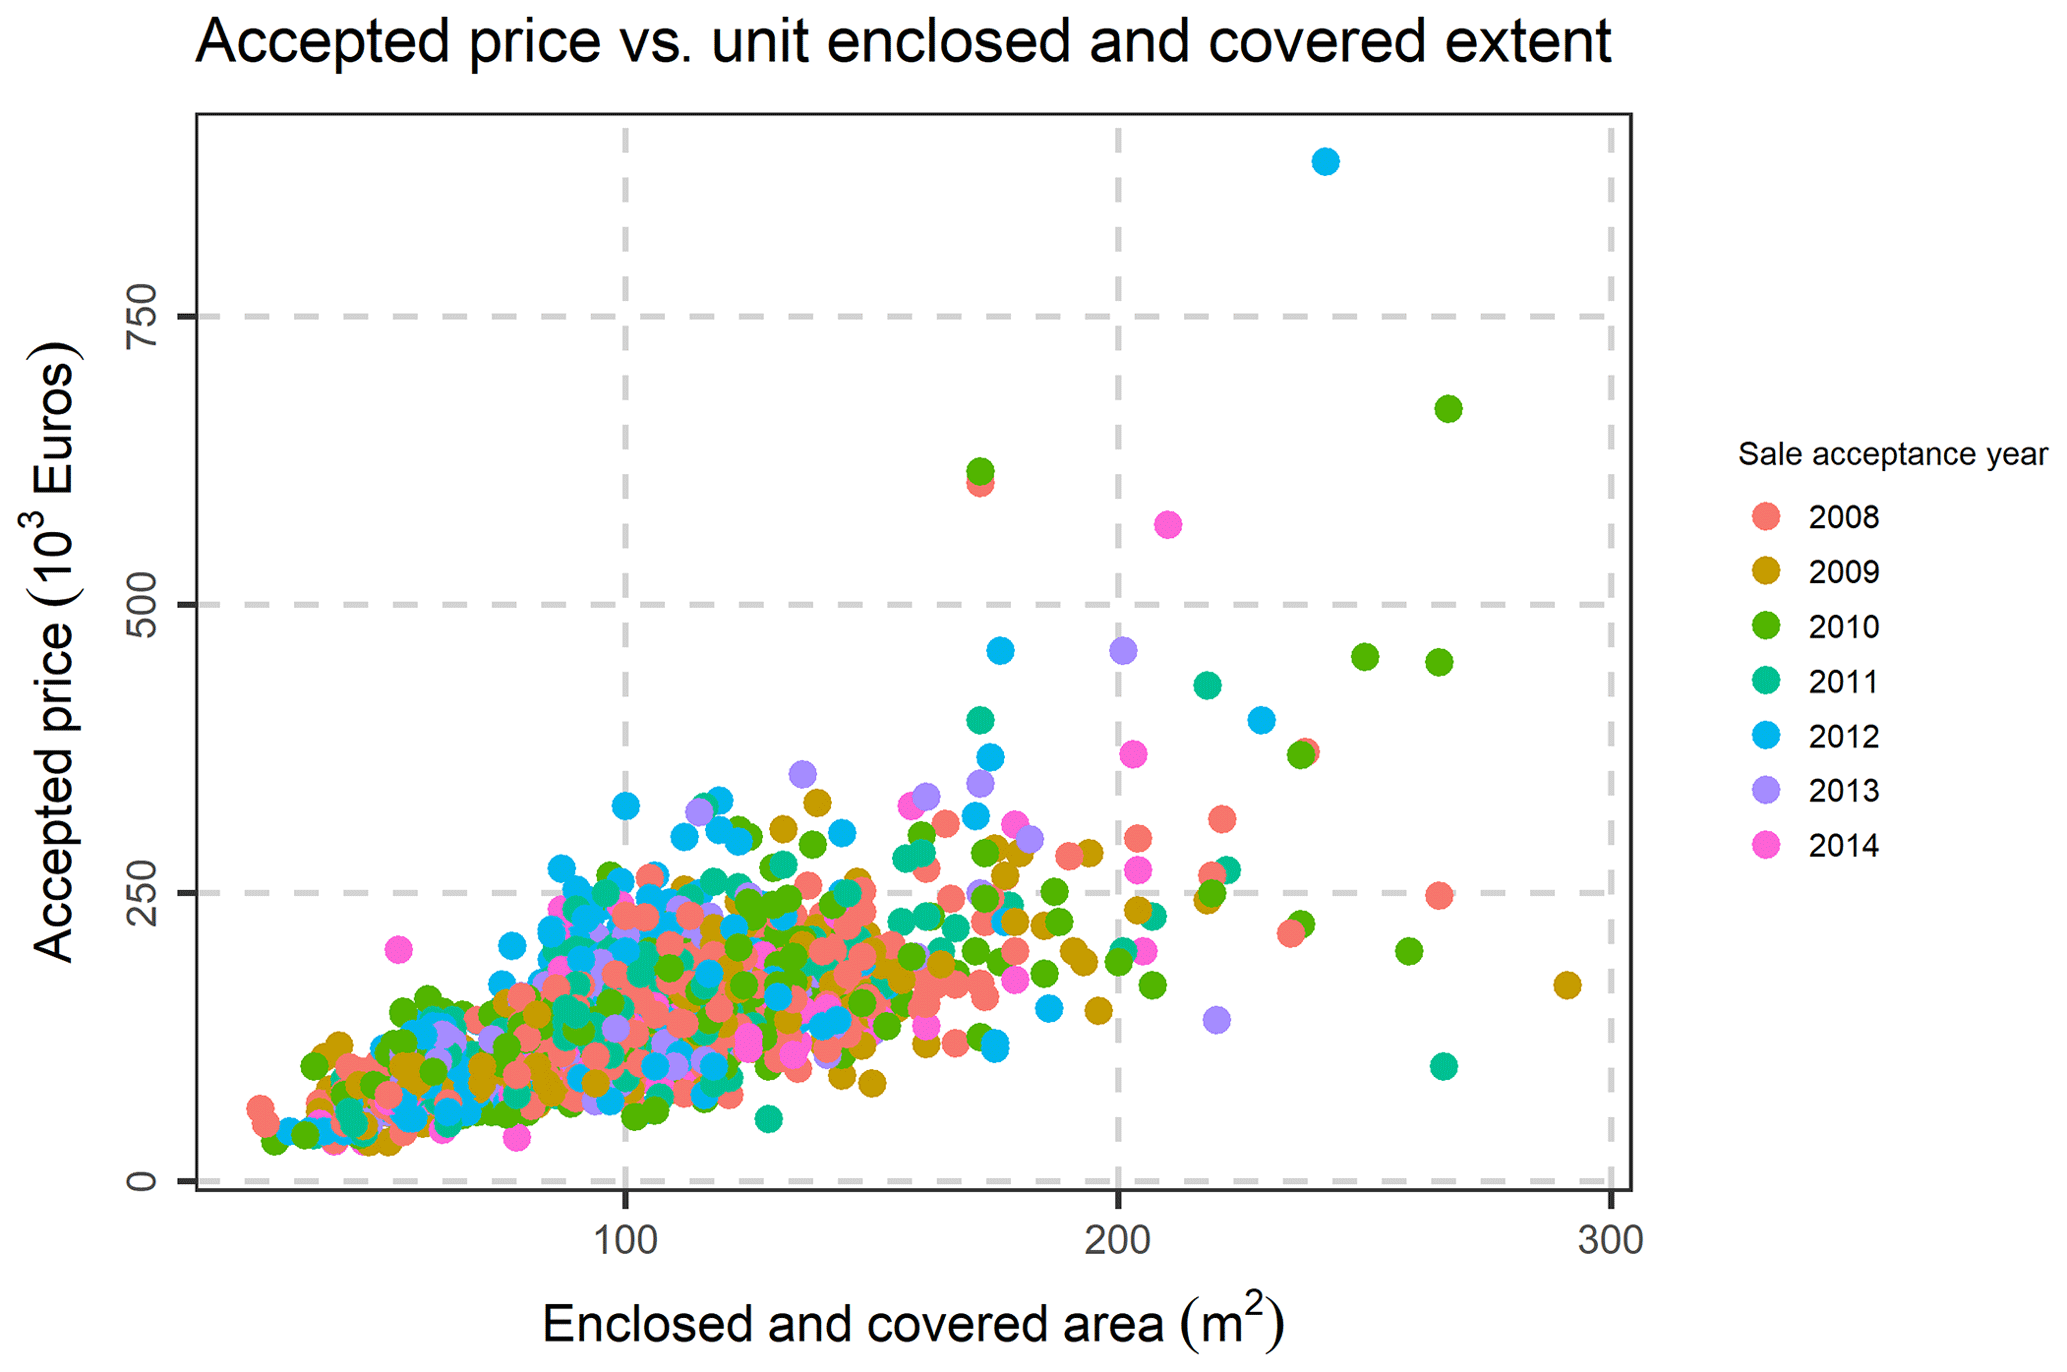
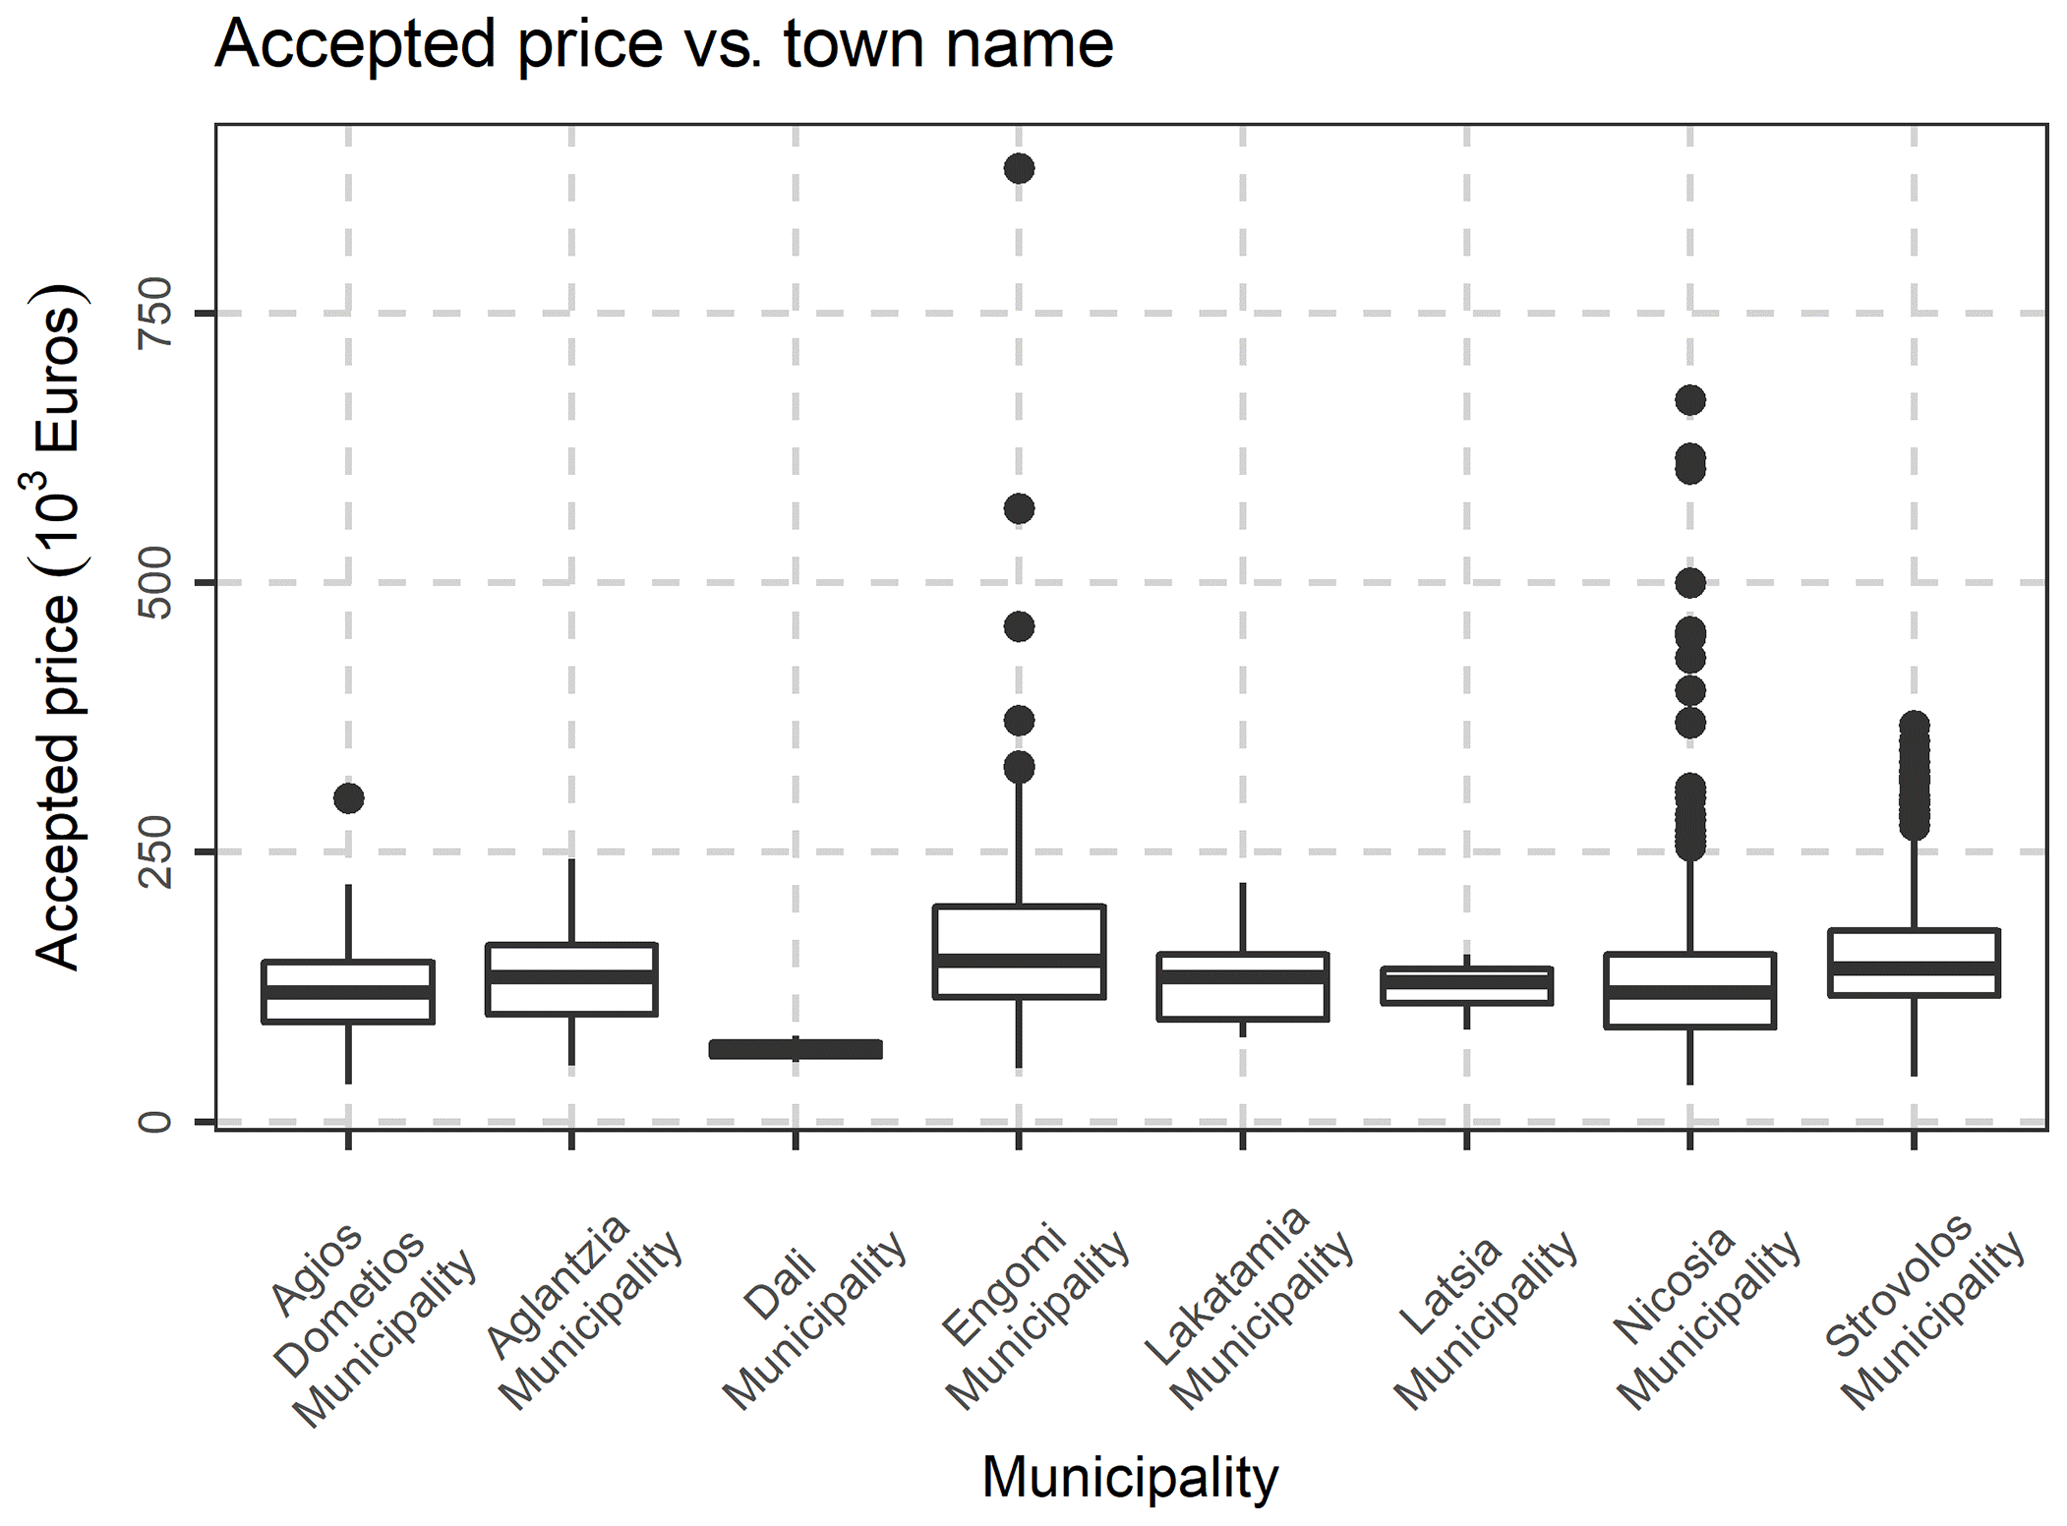
Last but not least, the following variables, were excluded, as they are not of interest in the present study: Fiscal property type, inflation increase sale acceptance date, Share numerator, Share denominator, Unit desc, Sale acceptance date, Unit built date, Sale acceptance month, sale acceptance quarter, Unit built month. The location (municipality) variables were transformed to nominal variables, and the database was rearranged accordingly. After the above-mentioned data preparation and cleaning, an initial exploration of the data was performed, by creating frequency tables, scatter plots and distribution graphs. In Fig. 5, the percentage of condition code per municipality is demonstrated, as well as each variation. In Fig. 6, the Histogram of the Declared Price is demonstrated, exhibiting a significant variation, as well as a skewed distribution. In Fig. 7, the Accepted Price vs. Unit Enclosed and Covered Extent are demonstrated, where the Price variation exhibits similar shapes among the studied years. as the majority of the observations were before the 2012–2013 Cypriot financial crisis. Finally, as it appears in Figs. 8 and 9, (Accepted Price vs. Municipality and Accepted Price vs. Planning Zone) the region of Engomi and Zones Ea3, Ka7 depicts the highest apartment prices.
The data refers to records of actual sale transactions. The two parties (buyer and seller) declare an amount of money to the DLS, however, sometimes the DLS performs a desktop valuation and in some cases the value accepted, might be different from the declared one (Declared vs. Accepted Price). At this point, it should be highlighted that buyer and seller have a special interest to declare a lower amount of money than the amount agreed. The buyer benefits by paying lower transfer fees, and the seller benefits by paying lower capital gains tax. On the other hand, the DLS, serving the government's interests, aims to collect more taxes. Thus, the quality of data collected is debatable, and further analysis, as is discussed in this paper, is necessary. This deviation among the Declared Price (DP) minus the Accepted Price (AP) vary within the range of zero (0.00) to eighty-three percent (+0.829) with a mean of approximately four percent (+0.0384). Accordingly, authors investigated this difference further, by using the normalization of the deviation (hereafter NDEV) in terms of price per square meter (of the adjusted area) as a more meaningful quantity for the properties, rather than the deviation (DP-AP). The PCs were divided into two categories, depending on their input values: continuous and categorical. Accordingly, in Fig. S1 in the Supplement, the distributions of the NDEV are depicted within the eight municipalities (those that are regulated from the Local Town Plan of Nicosia) of Nicosia District studied (Strovolos, Nicosia, Latsia, Lakatamia, Egkomi, Geri, Aglantzia, Agios Dometios). For seven out of eight municipalities, the mean NDEV varies within the range of 42.66 to 68.21 EUR m−2, while for the Municipality of Yeri, the mean NDEV equals to 116.07 EUR m−2. The reason for this is either because the DLS had an inaccurate understanding and impression of the property values in Yeri, or because the buyers had an additional motivation to under declare the value of the property (it should also be noted that the number of transactions in Yeri is not sufficient for the purposes of this study).

In order to confirm numerically the hypothesis that the DLS did not follow a specific method for the unacceptance of the declared price, a machine learning algorithm named Relieff (Robnik-Šikonja and Kononenko, 2003) was utilized. The aim was to detect dependencies among the PCs and DEV, while the Relieff was selected as a feature subset selection method, since it splits the data to k-nearest neighborhoods, by means of their normalized n-dimensional Euclidean distance. This procedure provides an unsupervised classification of the properties with similar characteristics. Accordingly, the importance of each particular variable to the response can be computed, depending on “if a change of this variable causes or does not cause a change of the class”. The dataset was split into 20, 40, 60, 80 and 100 classes, in order to examine whether the results depend on the volume. Finally, the Relieff method applied for all and for the non-zero values of the deviation as well. The calculated weights were lower than 0.025 for all the values (Fig. S2) and lower than 0.04 (Fig. S3) if only the non-zero values of the DEV were examined. In Relieff method, the value of zero indicates inexistence of association, while values close to the unit (one), designate high importance of the predictors, and the calculated values (<0.04) denote essentially no association.
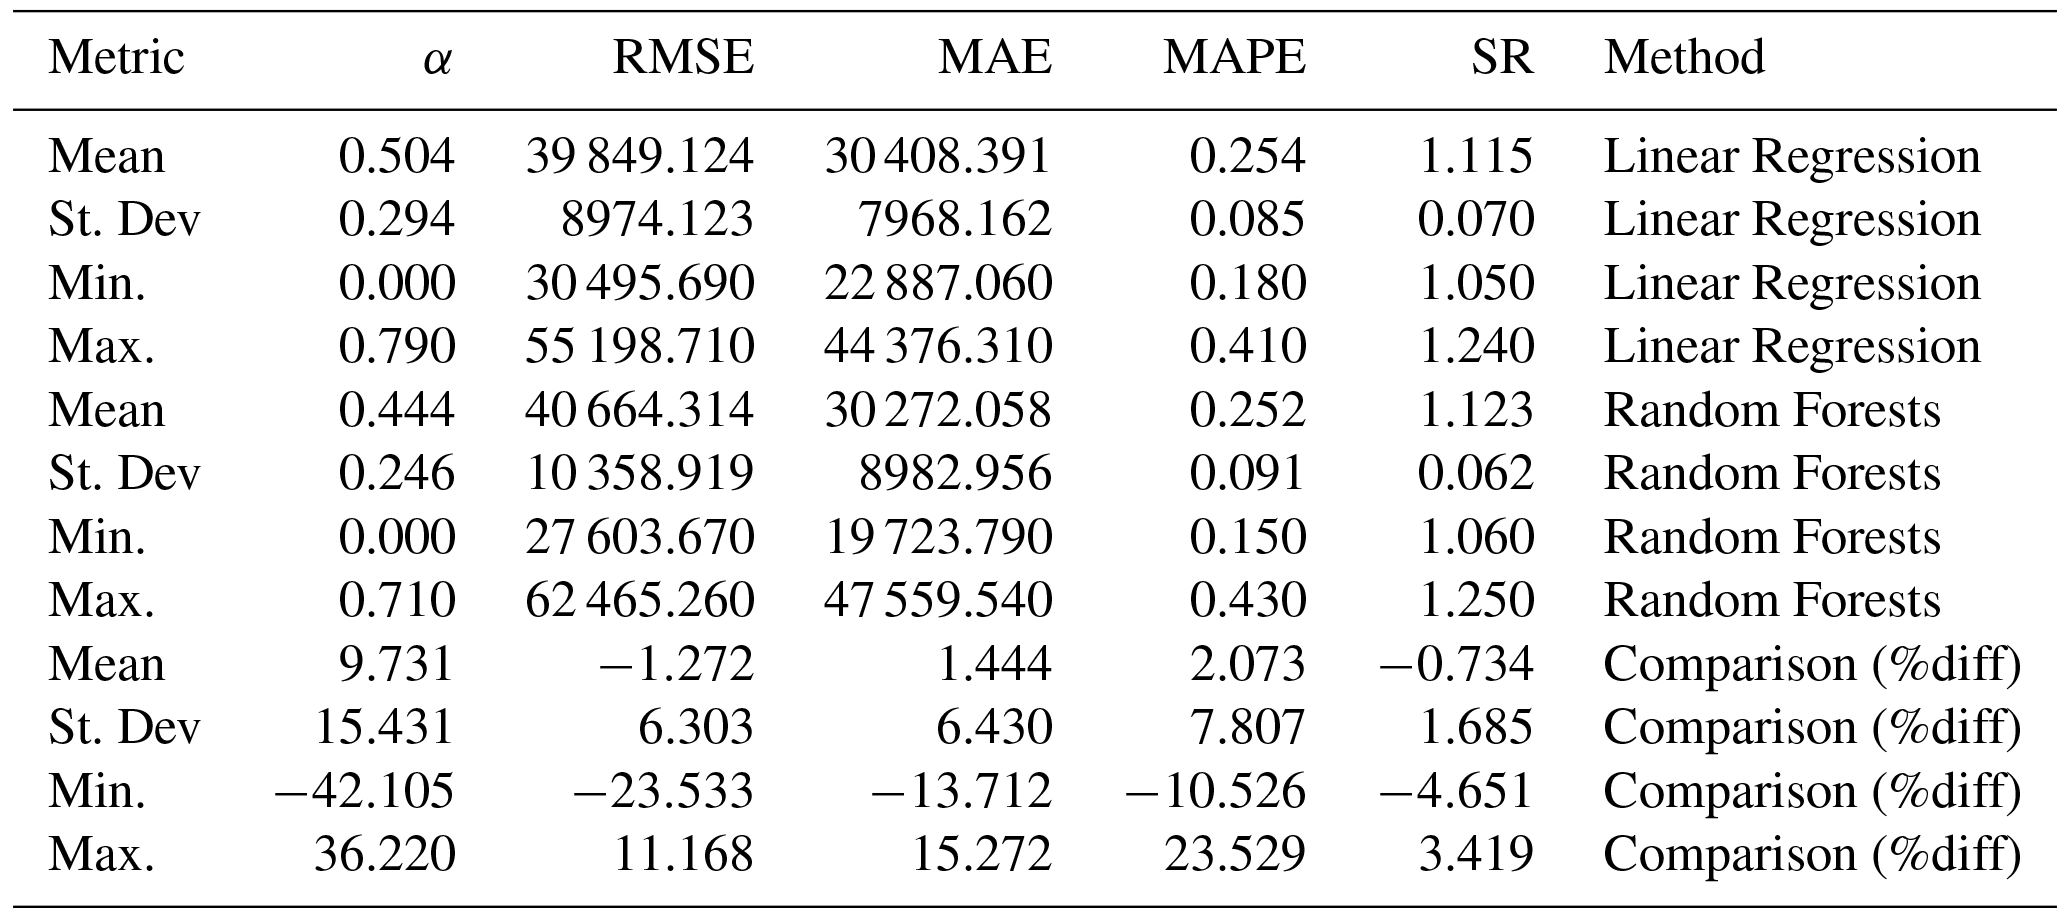
Accordingly, a training and a testing set were created, with the training set to be utilized to fit the studied models and the testing set, to test the out-of-sample accuracy of the models. The training set corresponds to the 80 % of the observations and the test set to the remaining 20 % (randomly permuted), while the accuracy measures were calculated for the test set. The investigated regression formulas are described in Table S1. The error metrics utilized in each model, either Linear regression or Random forest, with respect to the Predicted Values (PV), the Dependent Variable (DV), and the number of observations N, were: the linear coefficient α (Eq. 2), the Root Mean Squared Error (RMSE, Eq. 3), the Mean Absolute Error (MAE, Eq. 4), the Mean Absolute Percentage Error (MAPE, Eq. 5), and the Average Sales Ratio (SR, Eq. 6).
The detailed results are demonstrated in Table S2. For the comparison, the percentage difference (%diff) was utilized as:
With LR indicating each Linear Regression Measure and RF the corresponding measure of the Random Forests Method. The Accuracy metrics of the Eqs. (2)–(6) for each method, as well as their comparison (Eq. 7), are presented in Tables S2–S4 and accordingly, the Mean, the Standard Deviation, the Minimum and the Maximum for the models utilized in the investigation (Table S1) are summarized in Table 1. The means of the differences (Eq. 4) were 9.73 % for the Linear coefficient (Eq. 2), with the plus sign indicating positive values, and hence enhanced prediction of the Random Forests, −1.27 % for the RMSE, 1.44 % and 2.07 % for the MAE and MAPE and −0.73 % for the SR (Table 1). However, for the final five models (41–45), the differences for the RMSE were 7.87 % to 11.17 % lesser for the Random Forests Method than the equivalent of the regression (Table S4), signifying an important prediction accuracy of the RF method, and in particular when adequate variables are incorporated in the model.
Through this work, a comparative study of the prediction performance of the Random Forests method has been accomplished, with respect to the corresponding results of the Linear Multivariate Regression. A variety of regression models were scrutinized, apropos the independent variables involved, for both methods. The database regards actual transactions of the Cyprus Department of Lands and Surveys. A significant part of this work involved the data preparation and cleaning, the identification of the significant database features, as well as the handling of the missing values and the skewed input distributions. Furthermore, authors make suggestions for the mass appraisal system in Nicosia, examine the dependent variable (Accepted Price), its differences from the Declared Price (by the buyer and seller) and its dependency on the property's characteristics (independent variables). The overall performance of the Linear models and RF was in the range of approximately EUR 53 000 to 27 000 for the RMSE, for an average value of properties price EUR 150 000. The Random Forests outperformed the linear models with an RMSE difference up to EUR 3000 (7.87 % to 11.17 %). The most important predictor variables found to be the Enclosed Extend while other important variables are the Planning Zone Density and the Property's Class & Condition Code. However, although Random Forests exhibit low prediction errors and generalization ability (test set), an extensive analysis of the literature of some hundreds of papers, applying machine learning algorithms, demonstrated a lack of utilization of the real estate mass appraisals problem, highlighting further this work's contribution to the importance of machine learning and more specifically the Random Forests in mass appraisals.
The dataset is a property of the Department of Lands and Surveys of Cyprus and has been given to us only for post-processing for research purposes. Hence, it is not publicly avaiable. However, a detailed demonstration of the dataset is given in the Supplement.
The supplement related to this article is available online at: https://doi.org/10.5194/adgeo-45-377-2018-supplement.
The authors declare that they have no conflict of interest.
This article is part of the special issue “Earth surveillance
and space-based monitoring of the environment: integrated approaches”. It is
a result of the EGU General Assembly 2018, Vienna, Austria, 8–13 April
2018.
Edited by: Silas
Michaelides
Reviewed by: Tassos Labropoulos and Evgeny
Antipov
Antipov, E. A. and Pokryshevskaya, E. B.: Mass appraisal of residential apartments: An application of Random forest for valuation and a CART-based approach for model diagnostics, Expert Syst. Appl., 39, 1772–1778, 2012.
Benjamin, J. D., Guttery, R. S., and Sirmans, C. F.: Mass appraisal: An introduction to multiple regression analysis for real estate valuation, Journal of Real Estate Practice and Education, 7, 65–77, 2004
Breiman, L.: Random forests, Mach. Learn., 45, 5–32, 2001.
Dimopoulos, T. and Moulas, A: A proposal of a mass appraisal system in Greece with CAMA system. Evaluating GWR and MRA techniques. The case study of Thessaloniki Municipality, Open Geosci., 8.1, https://doi.org/10.1515/geo-2016-0064, 2016.
Liu, X., Deng, Z., and Wang, T.: Real estate appraisal system based on GIS and BP neural network, T. Nonferr. Metal. Soc., 21, s626–s630, 2011.
Plevris, V., Bakas, N., Markeset, G., and Bellos, J.: Literature review of masonry structures under earthquake excitation utilizing machine learning algorithms, COMPDYN, https://doi.org/10.7712/120117.5598.18688, 2017.
Pokryshevskaya, E. B. and Antipov, E. A.: Applying a CART-based approach for the diagnostics of mass appraisal models, Econ. Bull., 31, 2521–2528, 2011.
Robnik-Šikonja, M. and Kononenko, I.: Theoretical and empirical analysis of ReliefF and RReliefF, Mach. Learn., 53, 23–69, 2003.
SCOPUS database: available at: https://www.scopus.com/search/form.uri?display=basic, last access: 12 August 2018.
Wheeler, D. and Tiefelsdorf, M.: Multicollinearity and correlation among local regression coefficients in geographically weighted regression, J. Geogr. Syst., 7, 161–187, 2005.
The requested paper has a corresponding corrigendum published. Please read the corrigendum first before downloading the article.
- Article
(1729 KB) - Full-text XML
- Corrigendum
-
Supplement
(603 KB) - BibTeX
- EndNote