 | 23 Nov 2018
Tropospheric delay performance for GNSS integrated water vapor estimation by using GPT2w model, ECMWF's IFS operational model and in situ meteorological data
Christina Oikonomou
Filippos Tymvios
Christos Pikridas
Stylianos Bitharis
Kyriakos Balidakis
Silas Michaelides
Haris Haralambous
Demetris Charalambous
Tropospheric delay comprises one of the most important error sources in satellite navigation and is caused when radio signals broadcasted by GPS satellites propagate into the atmosphere. It is usually projected onto zenith direction by using mapping functions named as Zenith Tropospheric Delay (ZTD). ZTD is described as the sum of the Zenith Hydrostatic Delay (ZHD) and the Zenith Wet Delay (ZWD) and with the aid of surface pressure and temperature the integrated water vapor can be estimated. The main objective of this study is to evaluate the tropospheric delay performance for GNSS integrated water vapor estimation by using GPT2w model, ECMWF's IFS (ECMWF stands for the European Centre for Medium-Range Weather Forecasts) reanalysis model and ground meteorological data from two stations of the permanent network of Cyprus and Greece. The period from 27 May to 3 June 2018 is characterized by two different synoptic conditions: high pressure with fair weather in central Mediterranean (Greece), on the one hand, and high instability over the upper levels of the atmosphere that resulted in thunderstorms inland and mountainous areas during midday over the Eastern Mediterranean (Cyprus), on the other hand. In general, the results show that both the empirical blind model GPT2w and the ECMWF (IFS) operational model perform well in particular over Nicosia when used for the retrieval of Integrated Water Vapor (IWV) from GNSS measurements, although appreciable deviations were observed between ECMWF (IFS)-retrieved IWV and the one retrieved from GNSS observations by using meteorological measurements. A sharp increase of IWV prior to the abrupt rainfall events during noon on 30 and 31 May over Nicosia was also found.


A plethora of space-based radio-navigation systems is available for precise positioning and navigation applications: the United States' Global Positioning System (GPS), the Russian Global Navigation System (GLONASS) and the European Union's GALILEO are global operational Global Navigation Satellite Systems (GNSS), while the regional Chinese BEIDOU system will be globally deployed in 2020. The signals from the satellites received by permanent reference ground stations interfere with the ionosphere and the water vapour in the lower part of the atmosphere, the troposphere. Whilst the ionospheric delays are dispersive and can be eliminated using different frequencies, the tropospheric delays are frequency-independent and need to be modelled appropriately. In this respect, the raw data collected from GNSS stations contain valuable information concerning the water vapour distribution in the troposphere; the signals are processed and analysed to estimate tropospheric products. With the knowledge of surface pressure, the Zenith Total Delay (ZTD) can be estimated, and with the subsequent contemplation of temperature the Integrated Water Vapor (IWV) can be approximated.
Due to the fact that measurements of surface pressure and temperature are not available for all sites of interest and are not provided at a regular grid too, various interpolation techniques that employ the nearest to the site tropospheric data, as well as empirical blind tropospheric delay models, have been developed to resolve the data scarcity issue. In this respect, we note the Potsdam mapping functions (Balidakis et al., 2018) with the underlying numerical weather model ECMWF”s ERA-Interim and ERA5 (European Centre for Medium-Range Weather Forecasts Integrated Forecasting System), the UNB3 (University of New Brunswick) model constructed by Collins and Langley (1997), the Tropgrid model created for the Galileo navigation system (Krueger et al., 2005), and the GPT2w model (Böhm et al., 2014). The latter, which comprises a commonly used model, is based on the relatively new ERA-Interim reanalysis datasets provided by ECMWF and is also employed in the current investigation. Lately, a considerable number of studies have been conducted aiming to evaluate the capability of GPT2w model to retrieve precipitable water from GNSS measurements. Rahimi et al. (2017) assessed the effect of several tropospheric models including GPT2w on derived precipitable water over southeast Asia, while Olalekan et al. (2015) estimated the accuracies of the GPT2w and UNB3m (that is a new version of UNB3, where m stands for “modified”) tropospheric correction models over Africa by using global IGS (International GNSS Service) network's GNSS observational tropospheric zenith delay time series. However, to the best of our knowledge, no study has been reported so far assessing the tropospheric delay performance for GNSS integrated water vapor estimation over the south-eastern European region where surface observations and radiosonde information are rare, both spatially and temporally. Furthermore, this area is considered as highly sensitive to extreme weather events induced by the generally acknowledged climate change (Giorgi, 2006).
The real-time determination of ZTD and IWV and their assimilation thereof into numerical weather prediction models proved to give a positive impact on the lower tropospheric humidity field with a significant improvement on the representation of heavy summer rainfall. Several meteorological services have started exploiting GNSS-derived IWV to observe abrupt moisture increases at times between model forecast updates on an operational basis, resulting in a substantial improvement of forecast precipitation and tropical cyclones (Moore et al., 2015; Shoji et al., 2011).
To this end, this investigation is an initial attempt to evaluate the tropospheric delay performance for GNSS integrated water vapor determination by using GPT2w blind model, ECMWF (IFS) operational model and ground meteorological data from two stations of the permanent network of Cyprus and Greece, during the period of 27 May to 3 June 2018 where high pressure conditions were established extending over north Africa to central Mediterranean up to the Balkan area blocking the prevailing climatological westerly flow over the 600 hPa and above, and a cold pool associated with a cut-off low over eastern Mediterranean (Cyprus) resulting to fair weather and midday thunderstorms respectively.
2.1 GNSS and meteorological datasets
In this study, GNSS data from two permanent stations from Greece and Cyprus were used. The first is the Elassona station, named ELAS, located at Elassona in Thessaly, Central Greece (39.53∘ N, 22.12∘ E, 303 m) managed by the GNSS_QC team of the Aristotle University of Thessaloniki (Fotiou and Pikridas, 2012; Pikridas et al., 2014). The second is the Nicosia station located at Athalassa to the southeast of Nicosia, named NICO (35.08∘ N, 33.23∘ E, 162 m) that belongs to the Cyprus Department of Meteorology; this station participates in the EPN/EUREF network (Bruyninx, 2004). Elassona station is equipped with Leica receiver (model GR30) and is collocated with Vaisala meteostation (model PTU300), whilst the Nicosia station is also equipped with Leica receiver (model GR25) and is located 15 m from the main synoptic meteorological station of Athalassa (WMO17607) with a proprietary data acquisition system utilising Vaisala meteosensors. The temperature, relative humidity and pressure sensors provide measurements every 2 s and the values are recorded as a 10 min linearly averaged value (World Meteorological Organization, 2010). GNSS stations have an observation recording rate of 30 s and the capability to record all available satellite constellations' signals (GPS, GLONASS, GALILEO, BEIDOU). Figure 1 shows the cluster definition of permanent GNSS network including IGS and EPN/EUREF stations that was employed during data processing with Bernese software.
A time span of 8 days was selected, namely, from 27 May until 3 June 2018. Under the frame of the European research project BeRTISS (Balkan-Mediterranean Real Time Severe weather Service), the GNSS data were analyzed on an hourly basis. The data were recorded using a satellite elevation cut-off angle of 10∘. It is important to note that in order to derive absolute ZTD estimates, the average length of baselines included in the processing should be over 500 km which coincides with the selection of several EUREF and IGS stations. These stations are included in the network processing scheme for datum definition and consistent absolute tropospheric estimation. Long baselines reduce the high level of correlation of the tropospheric delays which occurs on short baselines (Duan et al., 1996). The processing scheme concerns the use of the Bernese software v5.2 developed by the Astronomical Institute of the University of Bern (Dach et al., 2015). The ultra-rapid precise orbit information which refers to the current reference frame is used. IGS has decades of products that are archived which can be accessed through the ftp. To reduce the age of the prior, discontinued Predicted orbits, the IGS started the Ultra-rapid products officially in November 2000 (GPS week 1087). Ultra-rapid products are available for real time and near real time use. The products are released four times per day. The IGS_08.atx model with absolute antenna calibration values was applied. The Saastamoinen model (see Saastamoinen, 1972) with the Global Mapping Function (GMF) mapping function (Böhm et al., 2006) was also used in the processing. Once of the coordinates of the fixed station were set, the coordinates for the rest of the stations were obtain by means of the maximum observations percentage between the fixed stations and the others. Solutions for each processing sessions were combined with ADDNEQ algorithm of Bernese software and the final solution was derived. All the initial phase ambiguities of carrier frequencies were resolved using the QIF (Quasi Ionosphere Free) strategy (Dach et al., 2015). As it is known, carrier phase data are biased by an integer number of carrier wavelengths which called initial phase ambiguity and must be estimated from the data. In case phase ambiguity resolution is succeeded, high accuracy results are obtained. As a consequence, ZTD estimates were obtained with an accuracy of a few (2–3) millimetres.
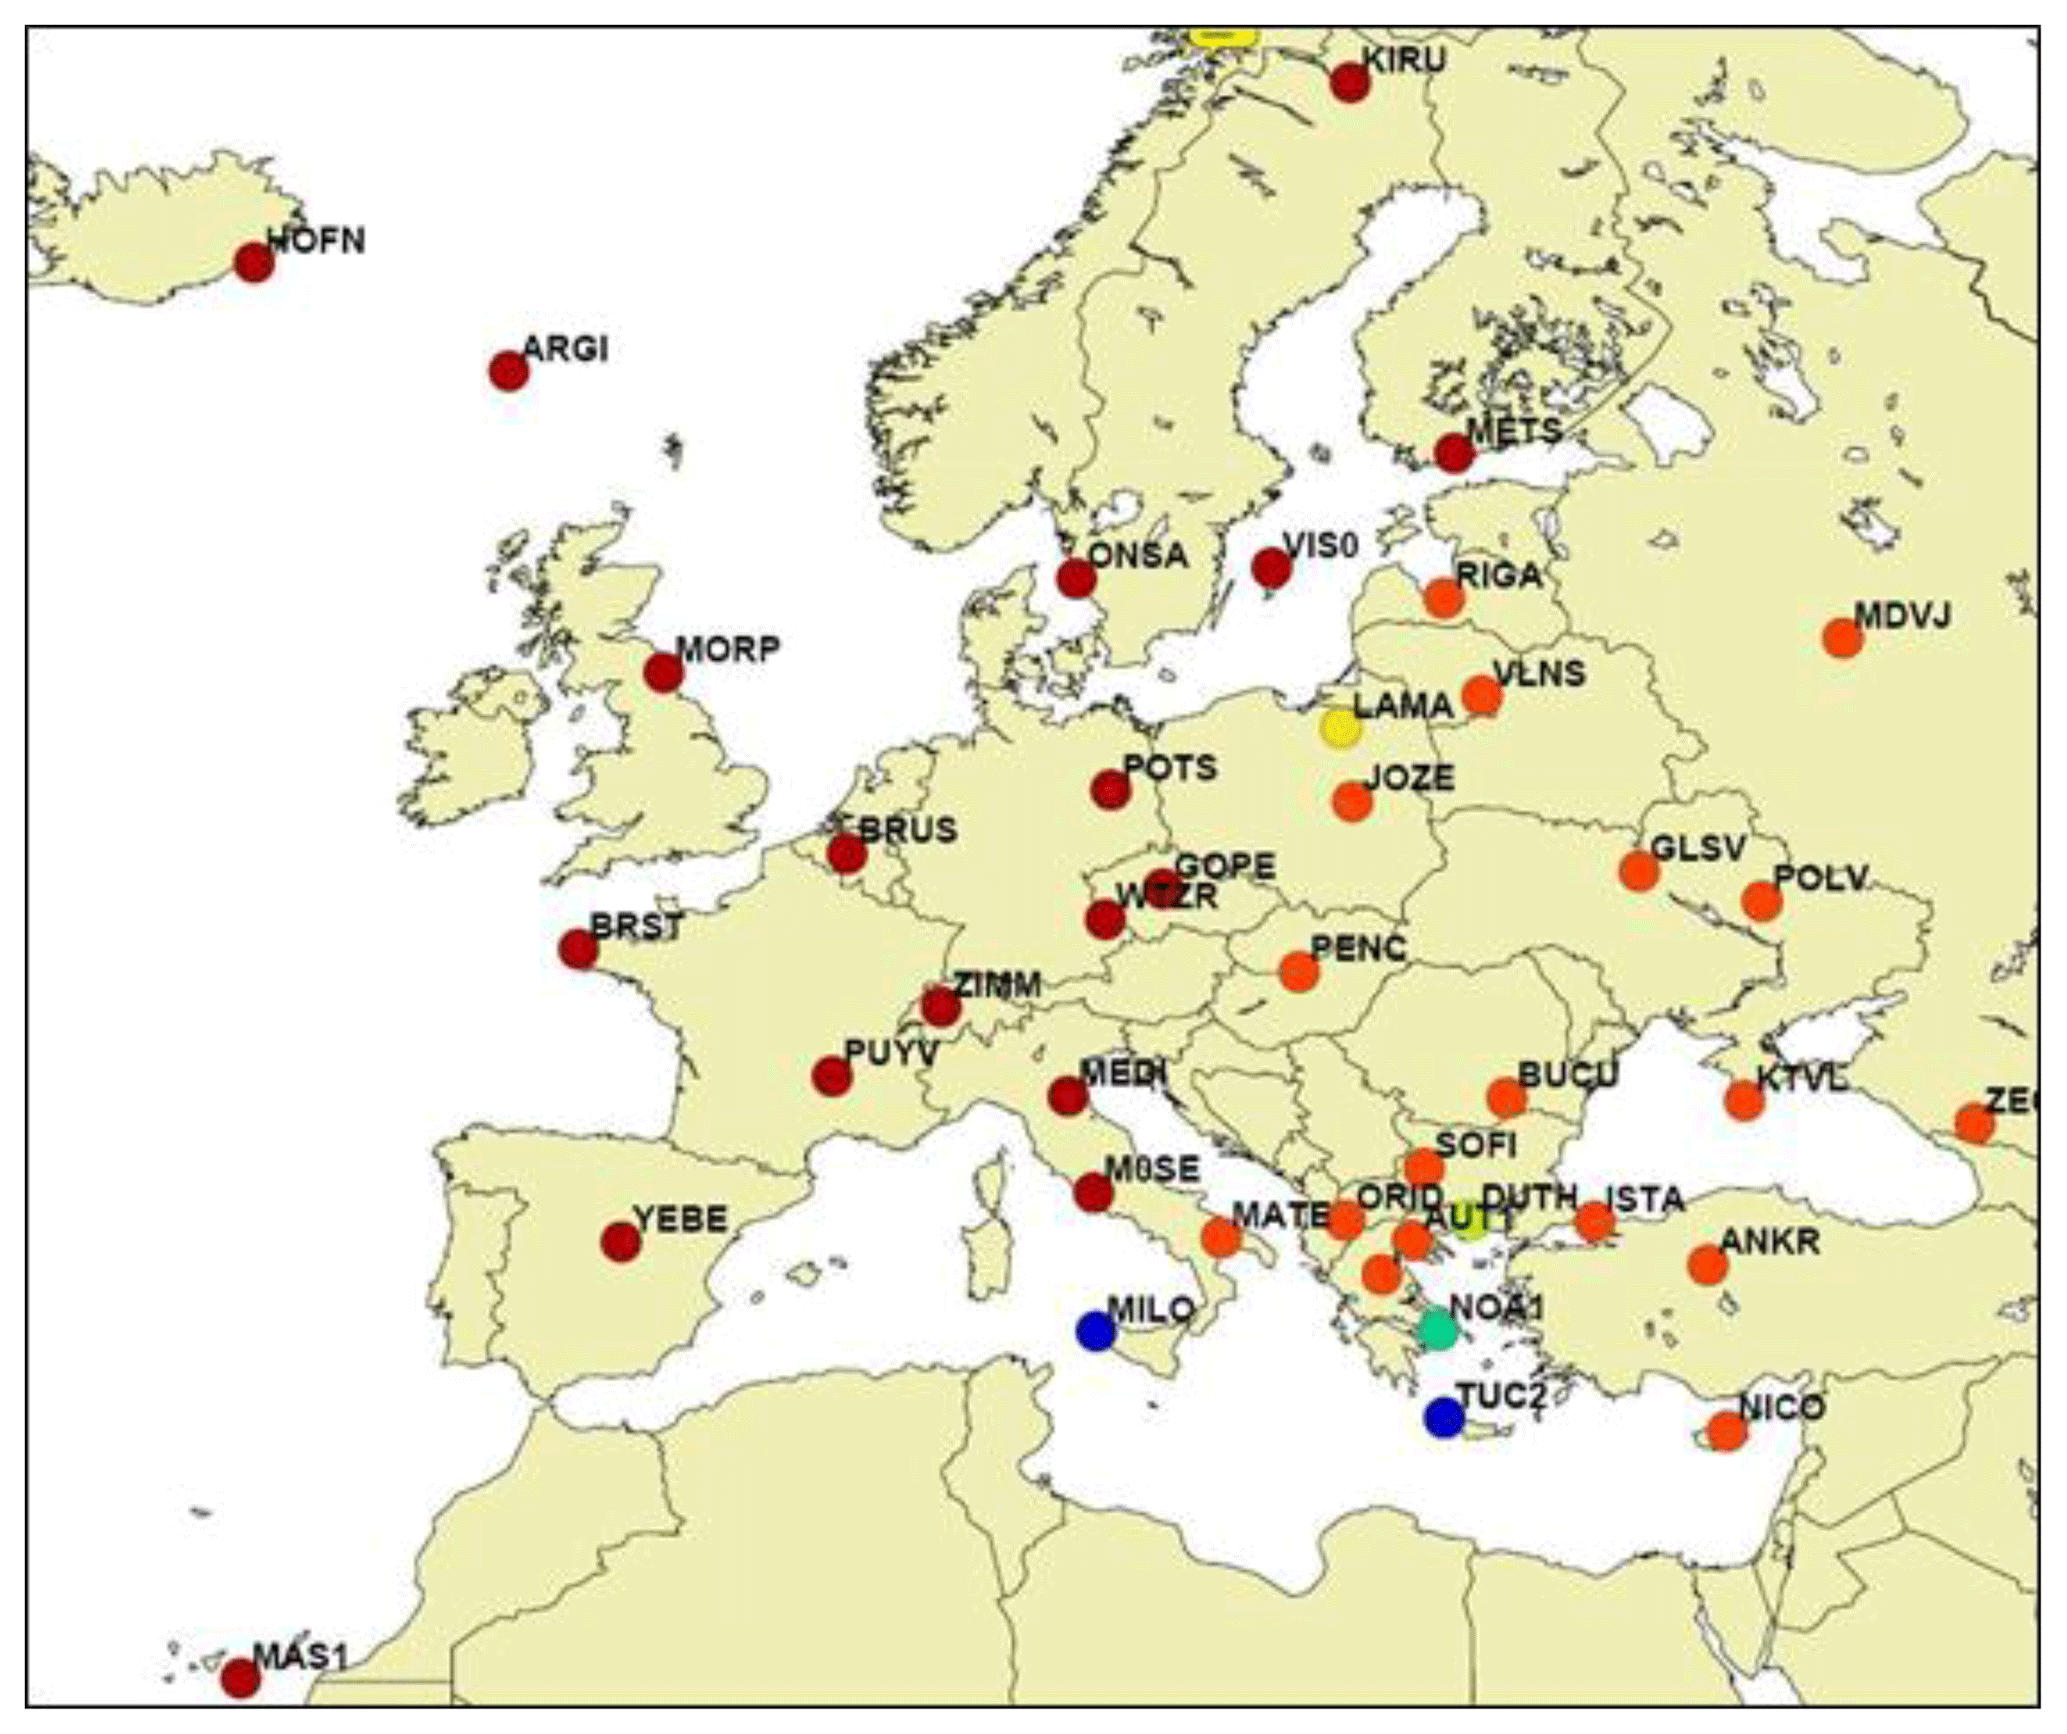
Figure 1Map of GNSS network including IGS and EPN/EUREF stations that was employed during data processing.
2.2 Retrieval of IWV from GNSS ground receivers – Converting the estimated zenith wet delays onto precipitable water
The delay which the wet component of the troposphere induces on GPS signals provides also an opportunity for sensing Precipitable Water (PW) with ground-based stations (Bevis et al., 1994). Precipitable Water (PW) is defined as the depth of water that would result if all atmospheric water vapor in a vertical column of air is being condensed to liquid. For this reason, Zenith Wet Delays (ZWD) estimated by GNSS can be converted to PW using the formula (Bevis et al., 1994):
where, the ZWD is derived from the relation , with ZHD depending on the dry air gases accounting for the greatest part of the tropospheric delay and
where, , k1=77.604 K hPa−1, k2=17 K hPa−1 and K hPa−1 and ρ=1025 kg m−3 is the density of liquid water, Ru=461.51 is the specific gas constant of water vapor, Tm is the water vapor weighted mean temperature of the atmosphere as defined by Davis et al. (1985) and m is the ratio of the molar mass of water vapor and dry air. The physical constants k1, k2 and k3 are from the well-known formula for atmospheric refractivity of Davis et al. (1985). In general, PW is related to ZWD by a factor (Π), that is approximately 0.15, however the actual value of factor Π can vary by as much as by 20 % (Bevis et al., 1994; Rózsa, 2014) since it is a a function of the weighted mean temperature of the atmosphere which varies with location, altitude, season and weather.
As a result, in calculating PW from Eqs. (1) and (2), the largest source of error is attributed to the mean temperature which varies according to location, height, weather and season. More specifically, the uncertainties in Π derive from the uncertainties in the mean temperature of the atmosphere Tm and in the physical constants k1, k2 and k3. Therefore, factor Π is a function of the weighted mean temperature of the atmosphere (Davis et al., 1985) and can be determined to about 2 % when it is computed as a function of surface temperature, or 1 % if data from numerical weather models are used. (Bevis et al., 1994; Businger et al., 1996). As it concerns the parameter Tm, Bevis et al. (1992) suggested that it can be estimated from the surface temperature. In our study, the mean temperature of the atmosphere in Kelvin, Tm, was estimated according to the formula by Mendes et al. (2000) which holds for mid-latitudes:
where, Ts is the surface temperature in Kelvin.
In this analysis, we adopted two ways for estimating the PW values (conversion to IWV). First, we retrieved (after routine analysis) the associated parameters from GPT2w model in order to compute the tropospheric component ZHD. Based on the approximation by Saastamoinen (1972), the ZHD can also be expressed as:
where, P is the atmospheric pressure, Φ is the station latitude and h the station's orthometric height. Subsequently, we compute the ZWD and finally the quantity IWV (Pikridas et al., 2014). The second calculation scenario was based on the estimation of the same parameters but instead of GPT2w values, we used the ground (real) meteorological records obtained from Vaisala sensors collocated to the respective GNSS receivers at Nicosia and Elassona sites.
2.3 GPT2w (Global pressure and temperature 2 wet) model data
The blind empirical model GPT2w (Böhm et al., 2014) produces the mean value plus annual and semiannual amplitudes of the pressure among else. Firstly, Böhm et al. (2007) constructed a blind model, named GPT, based on 3-year monthly mean profiles of pressure and temperature from the ECMWF 40-year reanalysis data (ERA40) for giving pressure and temperature for any user position and epoch (i.e., the measurement interval of a GPS receiver). Subsequently, Lagler et al. (2013) created GPT2, by improving and combining GPT and Global Mapping Function (GMF) using 10 years (2001–2010) of 37 monthly mean pressure isobaric level data from the ECMWF reanalysis (ERA-Interim). The latest GPT2w is an upgrade of GPT2 with an improved capability in the calculation of zenith wet delays in the blind mode. The GPT2w model with the gridded input file is available at http://ggosatm.hg.tuwien.ac.at/DELAY/SOURCE/, last access: June 2018. GPT2w and is based on global gridded values of tropospheric variables such as surface pressure for modelling the zenith hydrostatic delay or water vapor pressure, weighted mean temperature and water vapor decrease factor for modelling the zenith wet delay. To determine the pressure and temperature values at a GNSS station, the model first calculates the pressure and temperature values at four nearest grid points surrounding the station. Then, temperature is corrected for the altitude difference between the station and grid. For this reason, at each of the four grid points, the altitude gradient and the temperature lapse rate are added to the temperature value. As regards the pressure, values at these four grids at the height of the station are calculated using a vertical exponential trend coefficient related to the inverse of the virtual temperature. Finally, the pressure and temperature at the GNSS station are interpolated from the above four respective grid values. Nevertheless, according to several studies, GPT2w is considered a very good blind model, in general (Liu et al., 2017).
2.4 ECMWF's Integrated Forecasting System (IFS) operational model datasets
In this study, Zenith hydrostatic delays (ZHD) and non-hydrostatic (wet) delays (ZWD) are also obtained from the Potsdam mapping functions (PMFs) (Zus et al., 2014; Balidakis et al., 2018) with ECMWF's Integrated Forecasting System Cycle 43r1 featuring as the underlying numerical weather model. For the ray-tracing, the refraction index tensor and the position operator thereof are composed of 6-hourly employing surface pressure and geopotential fields at a horizontal resolution of approximately 9 km (O1280 spectral), and temperature and specific humidity tensors discretized at 137 model levels (L137). The IWV is calculated by numerical integration in the model level of ECMWF operational analysis, starting from the point of interest, which is the reference point of the GNSS station (NICO, ELAS), to the top of the model (∼80 km). Our choice of ECMWF's IFS is deliberate for it is a state-of-the-art model repeatedly tested for geodetic and remote sensing purposes. The data assimilation is based on a 12-hourly weak constraint four-dimensional variational system employing orography-following hybrid sigma-pressure levels. The high spatial resolution allows the description of orography-related fluctuations in the atmospheric state that in datasets such as ERA-Interim (80 km) would remain unresolved. This is particularly relevant for sites situated in regions with steep orographic gradients such as ELAS.
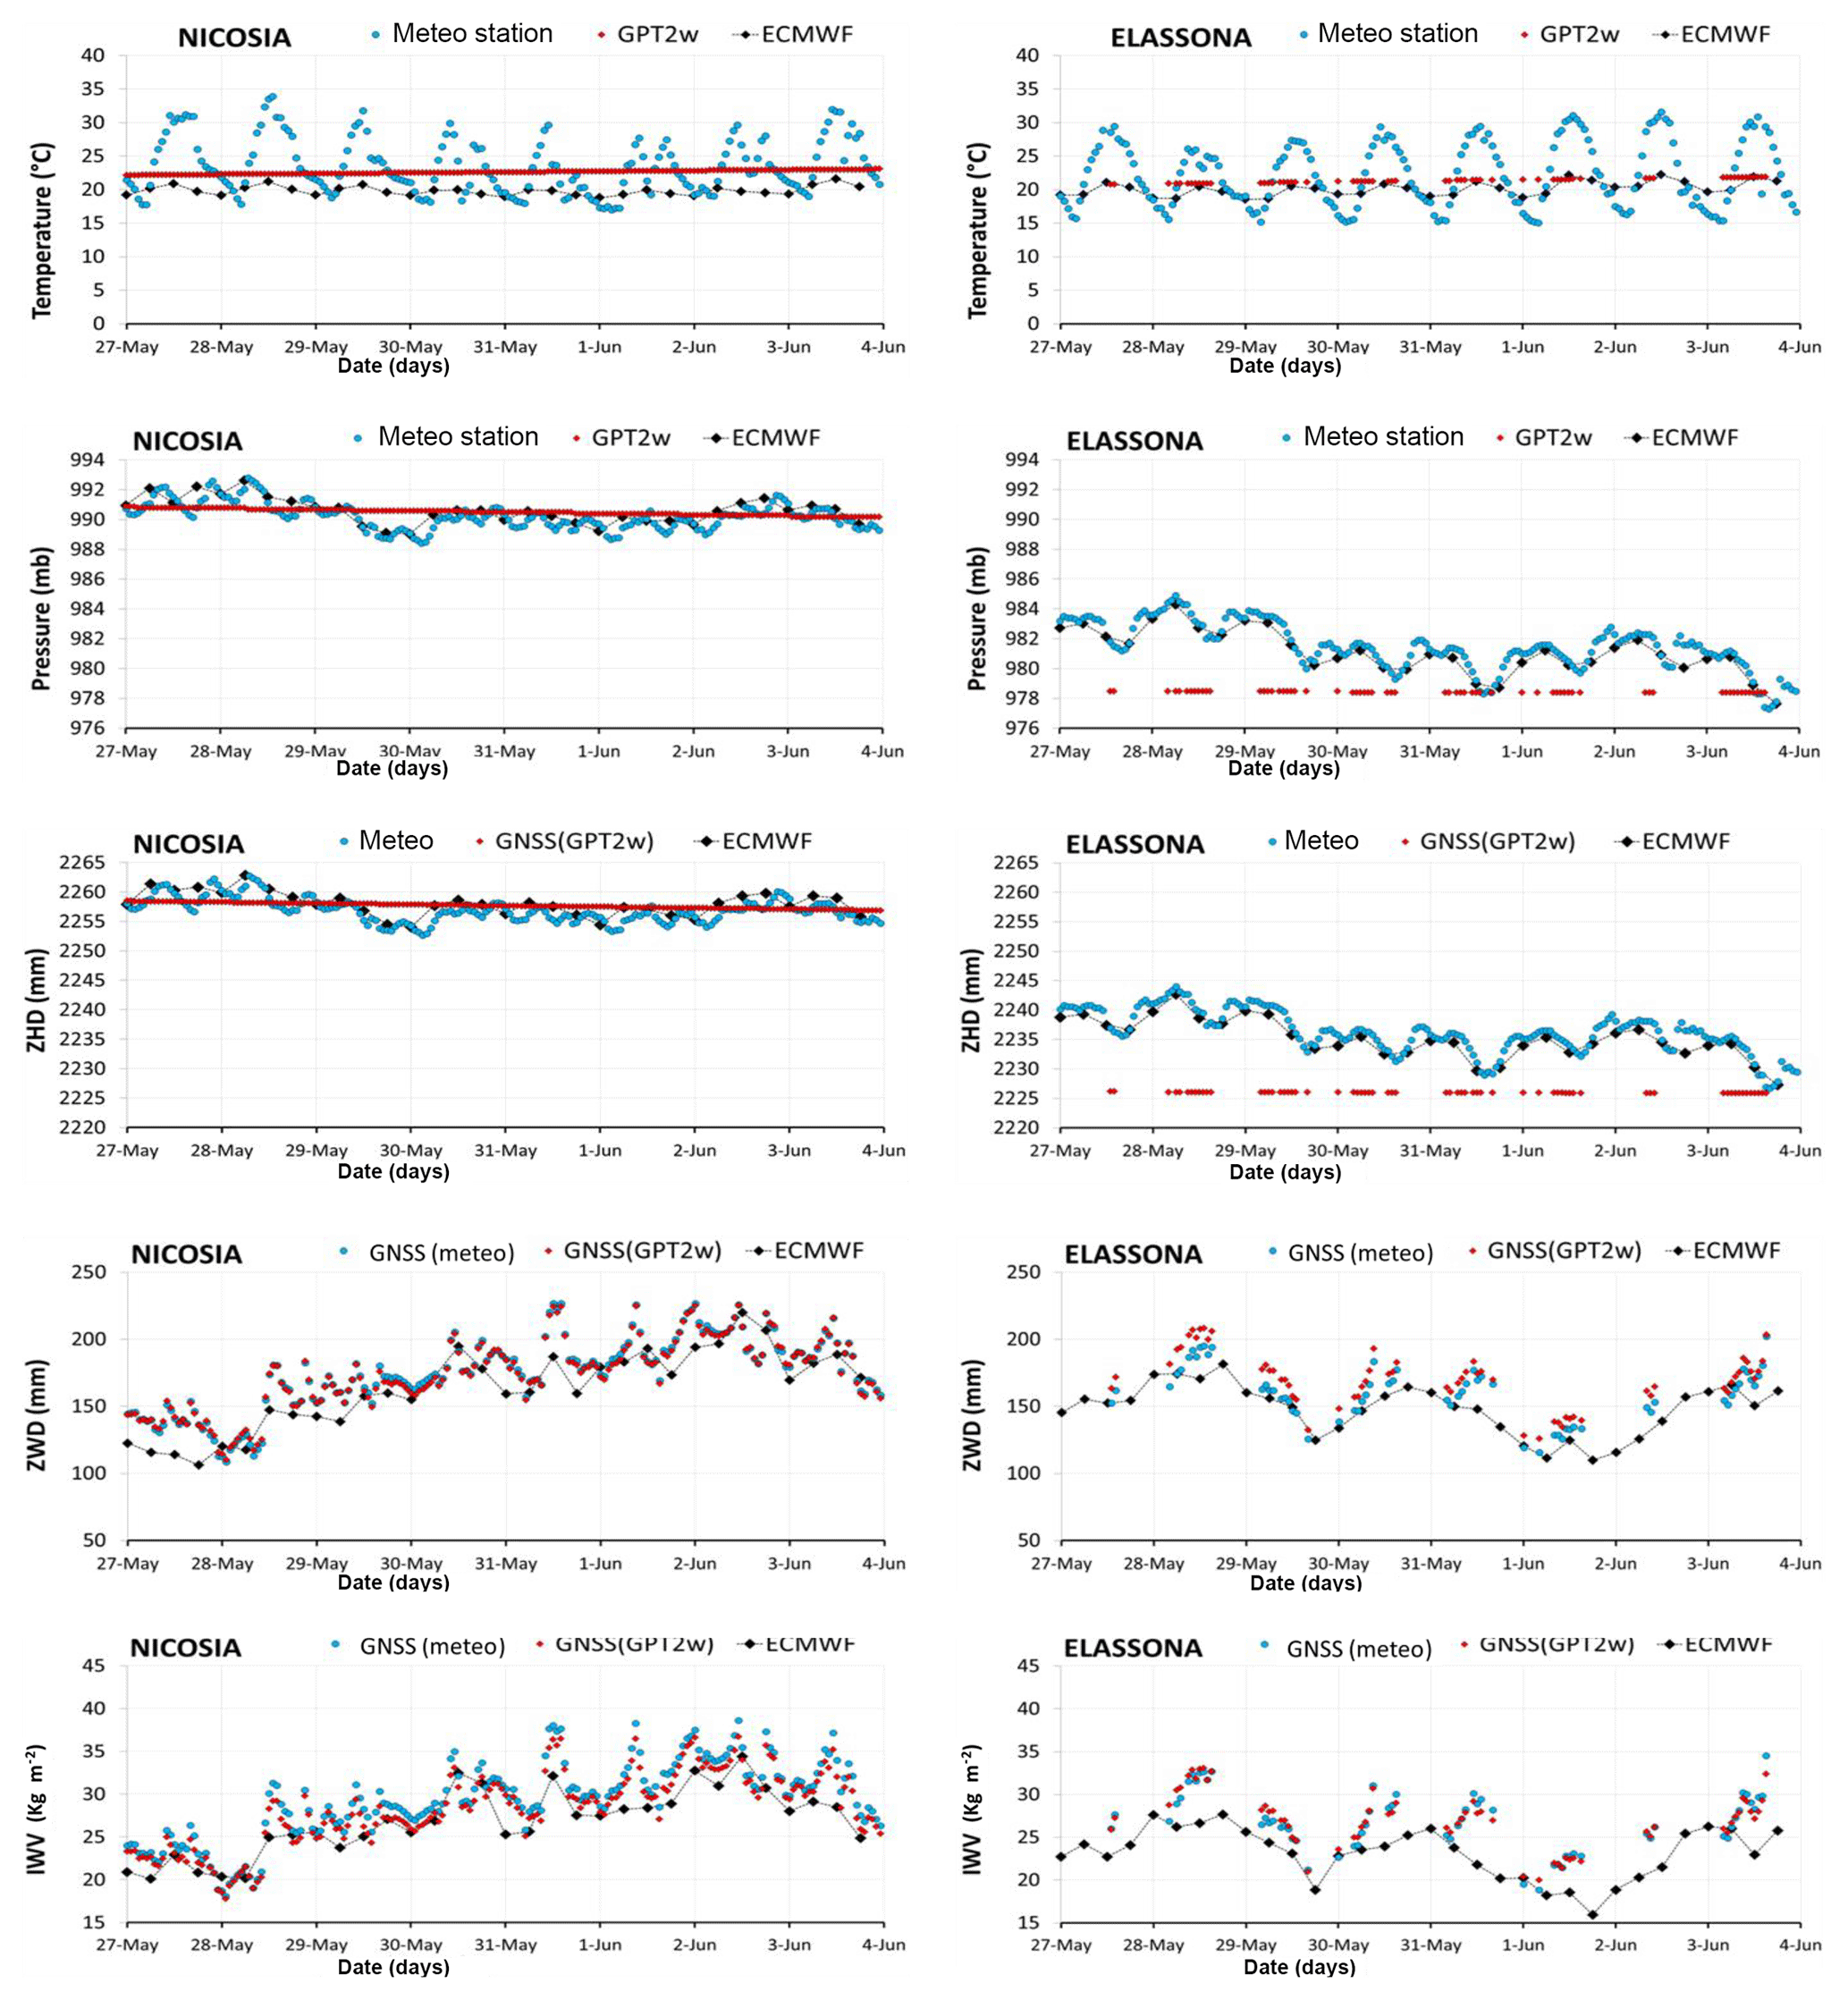
Figure 2Variations of T, P, ZHD, ZWD, and IWV for Nicosia and Elassona stations from collocated meteorological stations (blue dots), GPT2w (red boxes) and ECMWF (black boxes) spanning the period 27 May–3 June 2018.
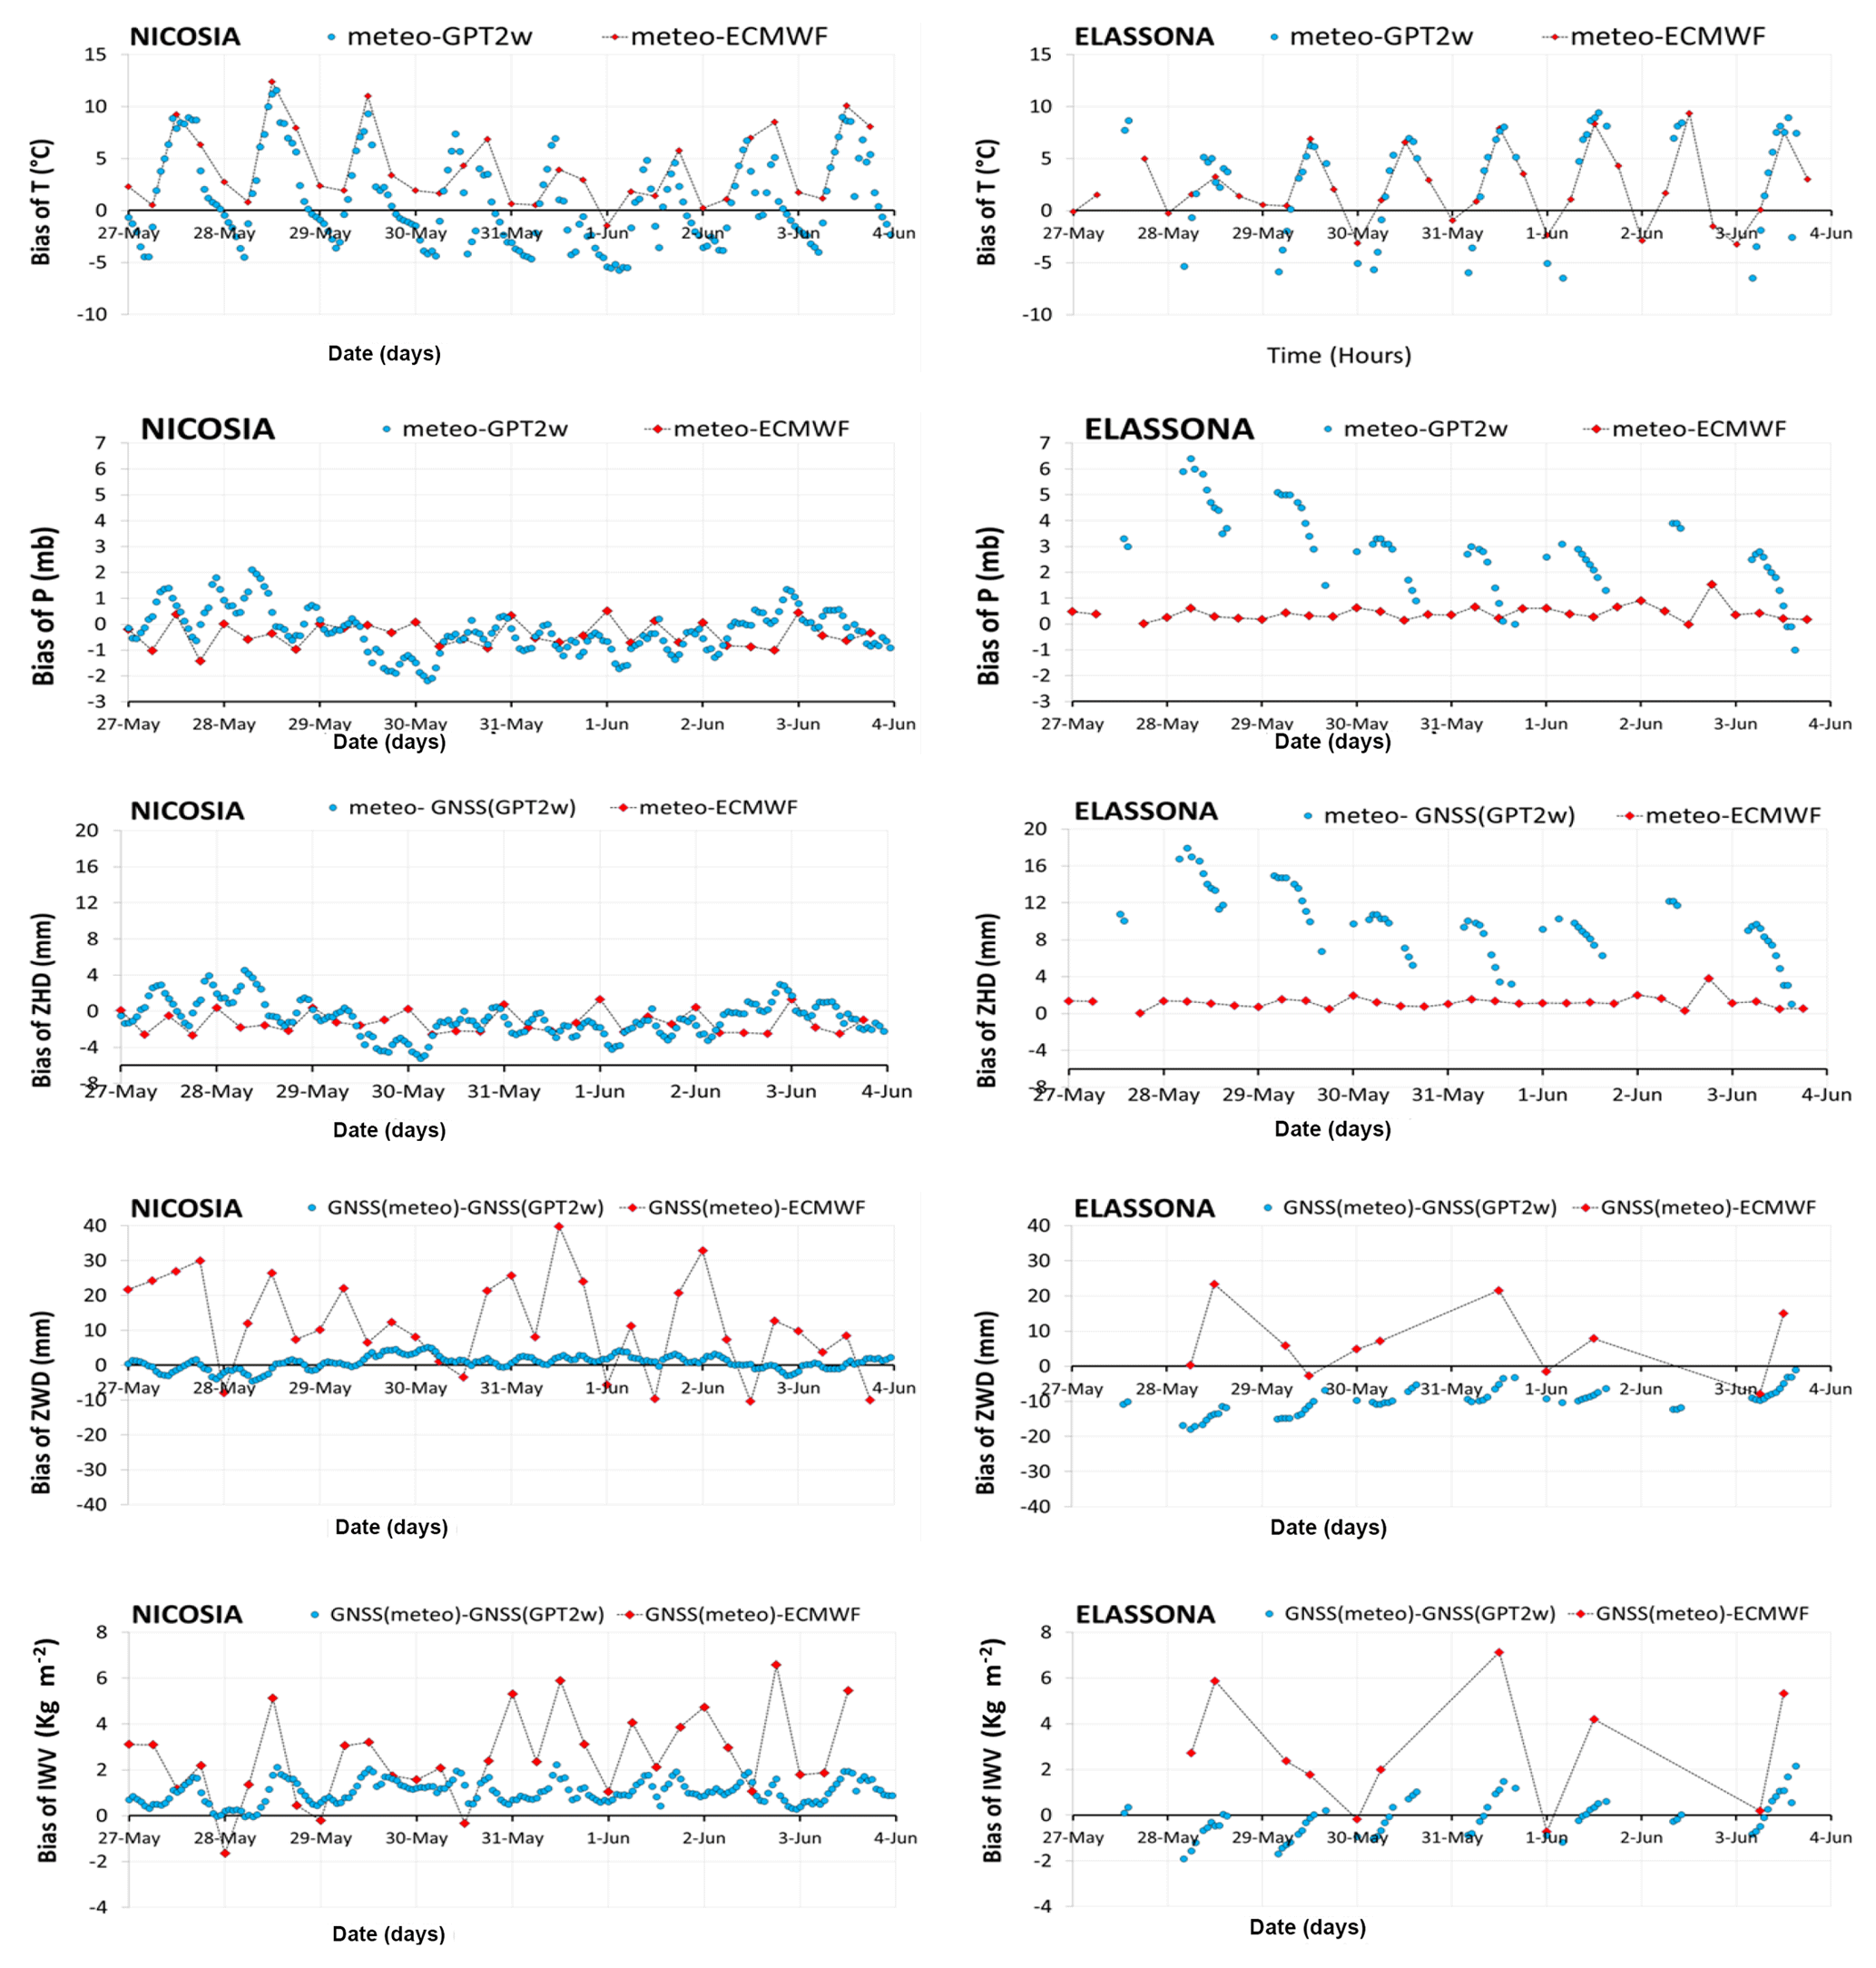
Figure 3Bias between in situ T, P observations and T, P values from GPT2w (blue dot) and ECMWF models (red box). Also, bias between ZHD, ZWD, and IWV values retrieved from GNSS observations by using T, P from collocated meteorological stations and the respective ZHD, ZWD, IWV values retrieved from GNSS observations by using T, P from GPT2w model (blue dots), the respective ZHD, ZWD, IWV values retrieved from ECMWF model (red boxes) for Nicosia and Elassona stations during 27 May–3 June 2018.
2.5 Methodology
To investigate the tropospheric delay performance for GNSS integrated water vapor estimation, we employed: (a) GPT2w model data, (b) ground meteorological records from meteo-stations collocated with the GNSS receivers and (c) ECMWF's (IFS) model data for the two sites during the period from 27 May to 3 June 2018, when abrupt heavy midday rainfalls, almost on a daily basis occurred at the station in Cyprus and fair weather conditions prevailed at the Greek station. It is worth noting that while the average area precipitation for the entire island is 19.6 mm for May and 13.2 mm for June, the local thunderstorms of 27–31 May and 1–3 June, produced an area averaged precipitation of 19.5 and 13.2 mm, respectively.
First, the capability of the blind model GPT2w and of the ECMWF (IFS) numerical prediction model to reproduce surface pressure and temperature variables is validated against in situ meteorological measurements over Nicosia and Elassona sites, by assessing the absolute bias (A1) and relative percentage deviations (D1) as follows:
In addition, the Standard Deviation and RMSE (root-mean-square error) of the differences between observed and modelled values for each station are computed and the time series of observed and modelled pressure and temperature variables are provided as well. The number of observations (points) used for RMSE are N=192 and N=65 for Nicosia and Elassona stations respectively.
Secondly, the tropospheric products: zenith hydrostatic delay (ZHD), zenith wet delay (ZWD) and integrated water vapor (IWV) are assed at the two sites as follows:
-
They are retrieved from GNSS observations by using surface temperature and pressure values from GPT2w model;
-
They are retrieved from GNSS observations by using surface pressure and temperature values from in situ meteorological stations;
-
By using ECMWF (IFS) operational model data as described at Sect. 2.4.
The results from the above three approaches are intercompared for both stations and for all three parameters (ZHD, ZWD, IWV), by means of time series and by calculating the absolute (A2, 3) and the relative (D2, 3) differences:
-
between parameters retrieved from GNSS observations by using GPT2w model atmospheric variables (T, P) and the respective ones retrieved from GNSS observations by using T, P obtained from in situ meteorological stations;
-
between parameters retrieved by using ECMWF (IFS) model and the respective ones retrieved from GNSS observations by using T, P obtained from in situ meteorological stations.
The following equations for the calculation of these differences are applied:
where, X represents either of ZHD, ZWD and IWV.
The variations of the in situ, the gridded GPT2w and the ECMWF model level-derived temperature and pressure values are illustrated in Fig. 2, for the period under investigation, for each of stations at Nicosia and Elassona. In both stations, the daily cycle of temperature is not captured by the GPT2w model which produces nearly constant temperature values over the whole time period. As GPT2w features only long wavelength harmonics, the diurnal cycle cannot be resolved. As a result, considerable deviations between in situ measurements and GPT2w occur (Fig. 3). In both stations, surface temperature is underestimated by GPT2w during daytime by as much as 10 ∘C at local noon. The maximum overestimation is recorded around sunrise (5 ∘C). At the Nicosia station, temperature is also overestimated by the model during 15:00 UTC on 30 and 17:00 UTC on 31 May and 15:00 UTC on 1 June, due to the abrupt temperature decrease caused by the thunderstorm activity occurring during midday and early afternoon in the close proximity to the Nicosia station which was not well captured by the model (overcast conditions before and during the thunderstorms, downdrafts mixing with surface air, latent heat absorption from evaporation process).
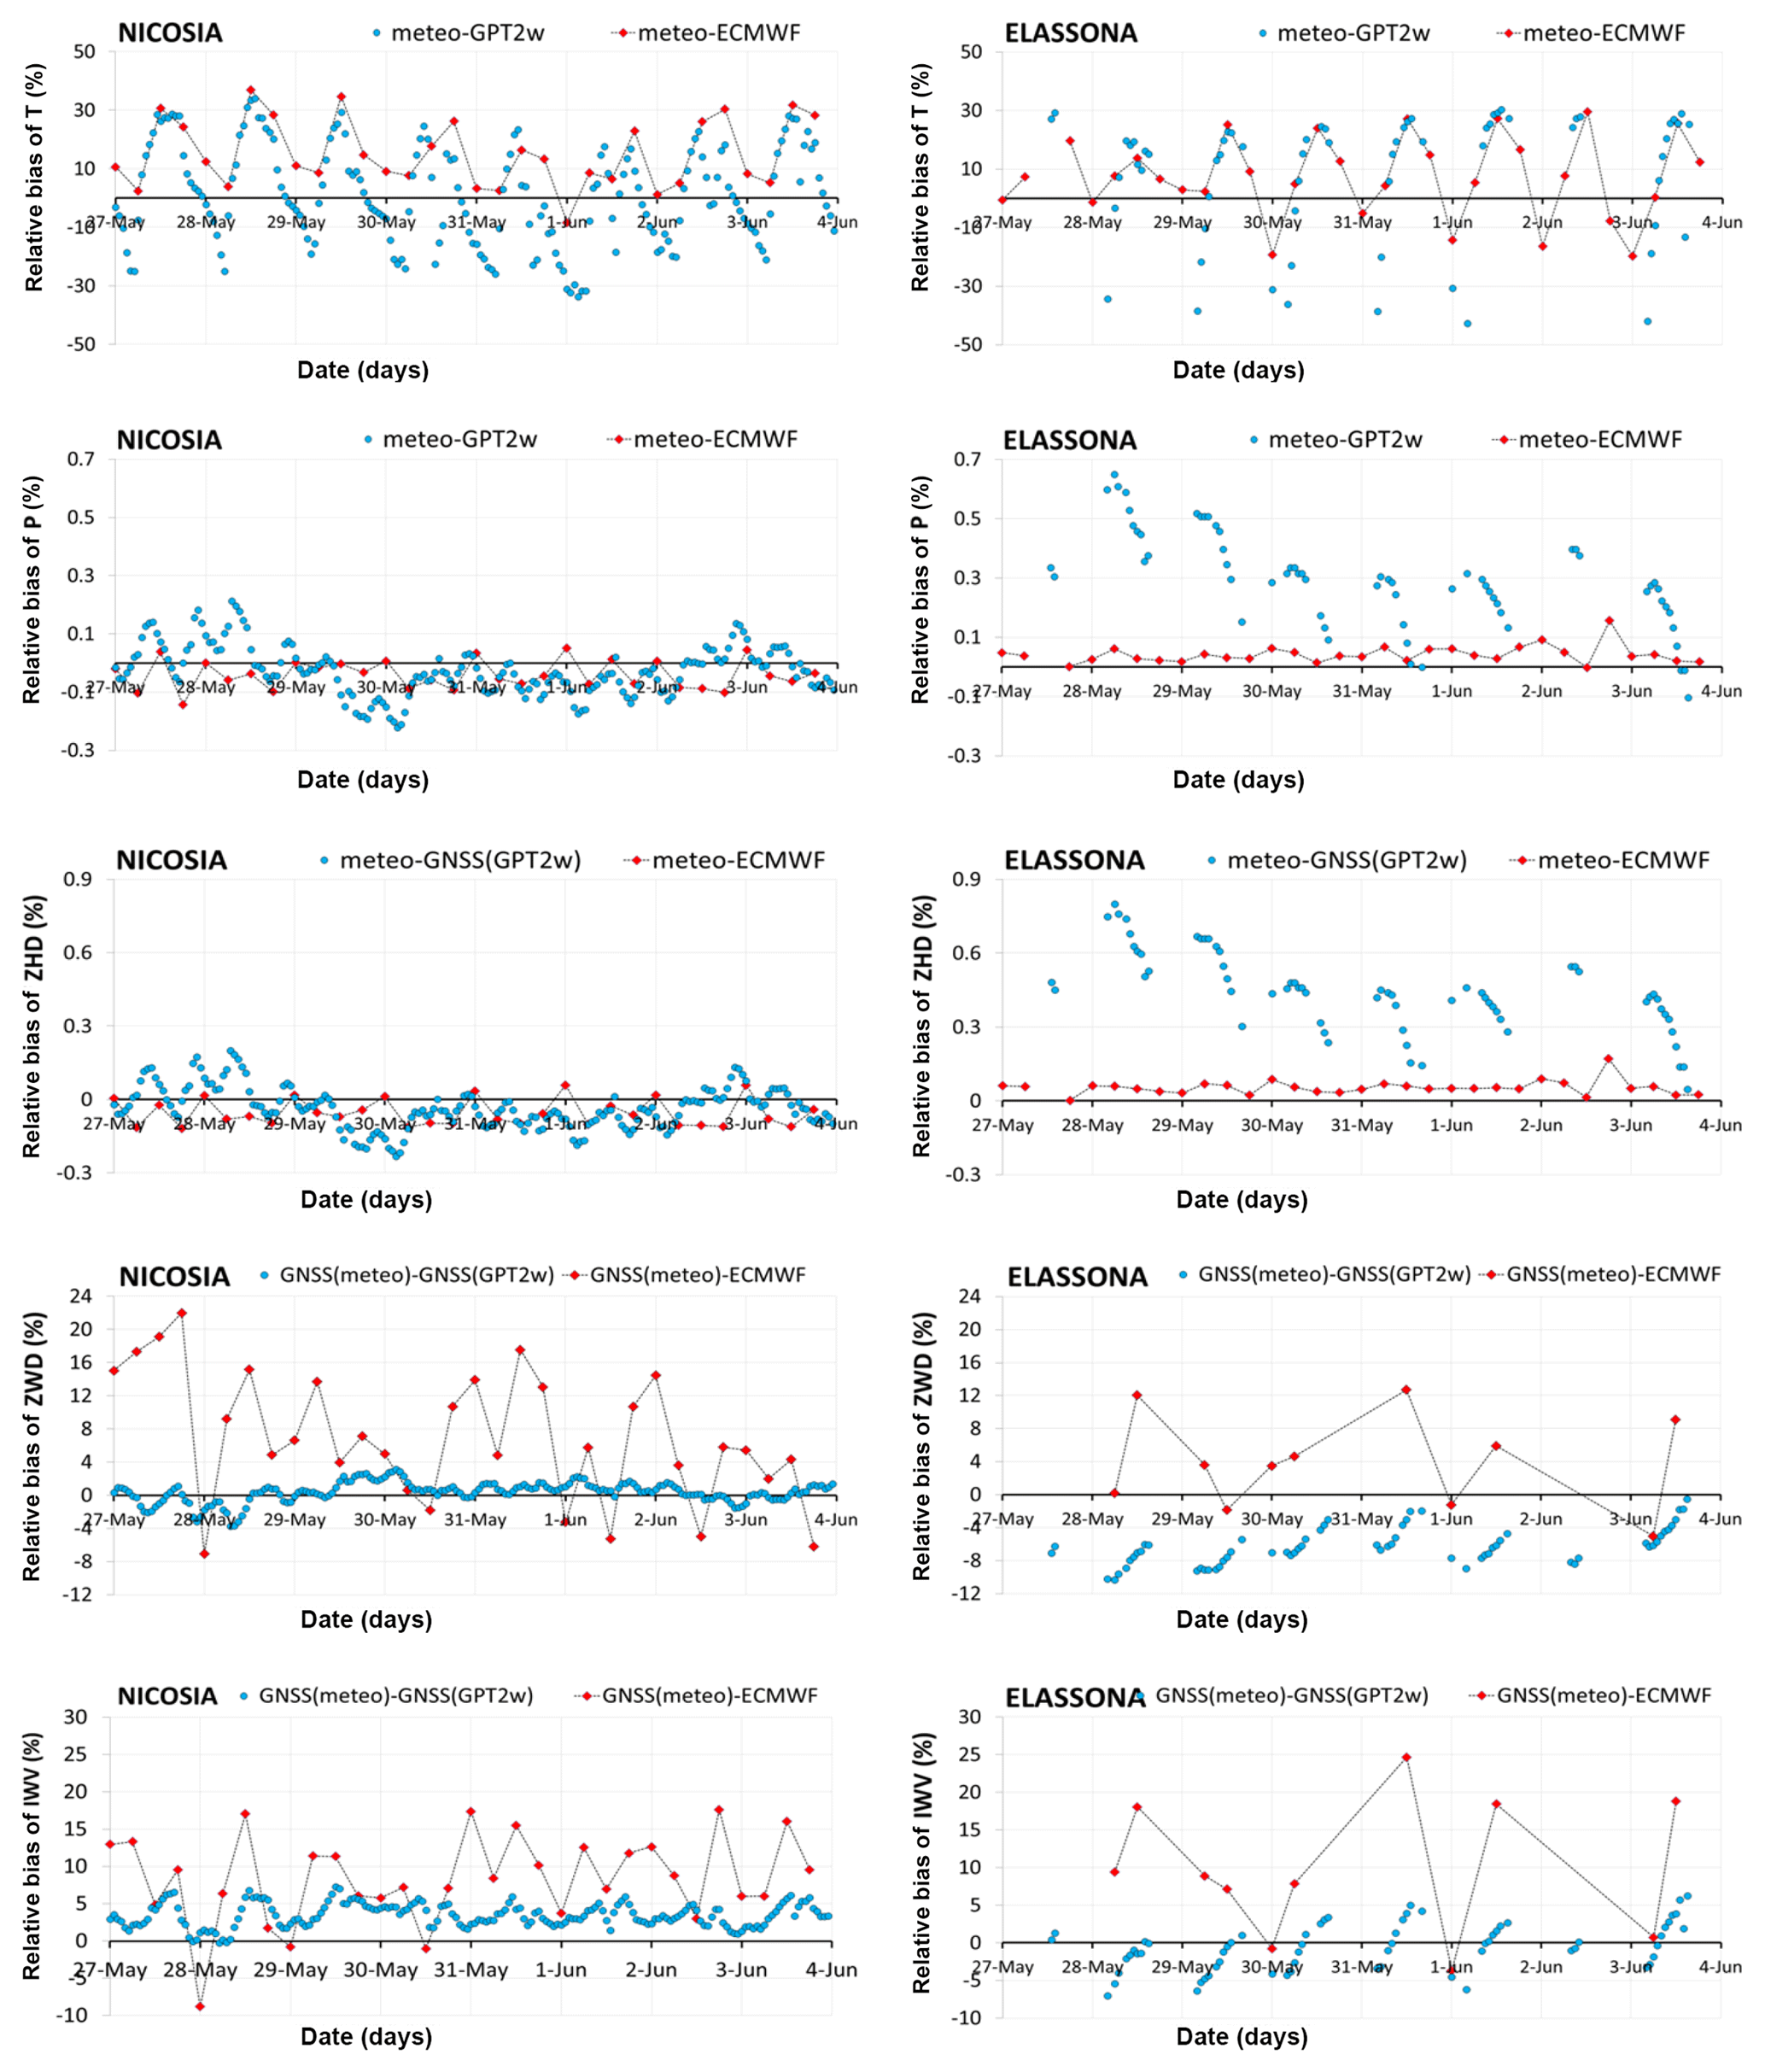
Table 1The RMSE of absolute bias and Standard Deviations (a) between in situ meteorological observations and GPT2w modelled values of T, P and (b) between parameters (ZHD, ZWD, IWV) retrieved from GNSS observations by using GPT2w model atmospheric variables (T, P) and the respective ones retrieved from GNSS observations by using T, P obtained from in situ meteorological stations, for both stations during the period of study.
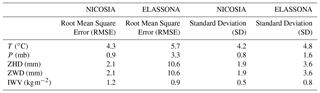
Similar to the absolute bias, the relative percentage deviations between modelled and in situ measurements are large at local noon and midnight hours (up to approximately 30 %) in both stations (Fig. 4). The RMSE of the temperature between GPT2w and observed meteorological values for each station is shown in Table 1; this is larger for Elassona (5.7 ∘C) than for Nicosia (4.3 ∘C) station. Also, from Table 1, it is apparent that the respective standard deviations of temperature bias are also greater in Elassona than in Nicosia station. The ECMWF model presents slightly higher daily variability compared to GPT2w blind model in both stations. The deviations of ECMWF from measured values are between 0 to 5 ∘C, apart from local noontime temperature deviations that are of the same order with the corresponding GPT2w deviations, reaching up to 10 ∘C.
In Fig. 2, the pressure variations are illustrated. In both stations, GPT2w predicted pressure values, like temperature values, are nearly stable during all days examined. The absolute (relative percentage) bias between predicted and observed values is minor and as high as 2 mb (0.2 %) and 7 mb (0.7 %) for Nicosia and Elassona stations, respectively (Fig. 3). The values of RMSE and standard deviation of the GPT2w pressure differences are also small (Table 1) and slightly larger in Elassona than in Nicosia. In contrast, ECMWF predicted pressure values agree very well with the corresponding observed values in both stations, following the diurnal cycle as well; thus the biases between ECMWF and measured pressure values are insignificant (up to approximately 1 mb and 0.1 % for absolute and relative percentage deviations, respectively) which are smaller than the corresponding GPT2w bias.
Considering that the ZHD is directly linked to pressure, as shown in Sect. 2.2, ZHD variability follows that of pressure; the deviations of the GPT2w and ECMWF values from the ZHDs calculated by employing in situ data present identical values with the respective pressure deviations. The RMSE and standard deviation of ZHD between the GPT2w-derived and those obtained from measured values are low as well. The ECMWF-derived ZHDs are much more consistent with ZHDs calculated from measured atmospheric variables than the GPT2w-derived ZHD values (Fig. 2).
The ZWD is related both to the temperature and ZHD, as shown in Sect. 2. The ZWD calculated from GNSS observations by using pressure and temperature from GPT2w is highly correlated with the ZWD calculated from GNSS observations by employing pressure and temperature provided from meteorological stations (Fig. 2); hence their absolute (relative percentage deviations) are small, with maximum values as much as 5 mm (4 %) and 18 mm (9 %) for Elassona and Nicosia sites, respectively. A minor overestimation of ZWD by GPT2w model is recorded at Elassona station during the whole time period. The respective ECMWF-derived ZWD values demonstrate considerable deviations (up to about 30 and 20 mm in Nicosia and Elassona stations, respectively) from ZWD values calculated from GNSS observations by using in situ meteorological observations in both stations. These deviations are most probably related to the adopted differential methods of IWV assessment that is numerical integration of relative humidity by the model and approximation of GNSS observations. The daily ZWD variability is well-captured by the ECMWF model in both stations.
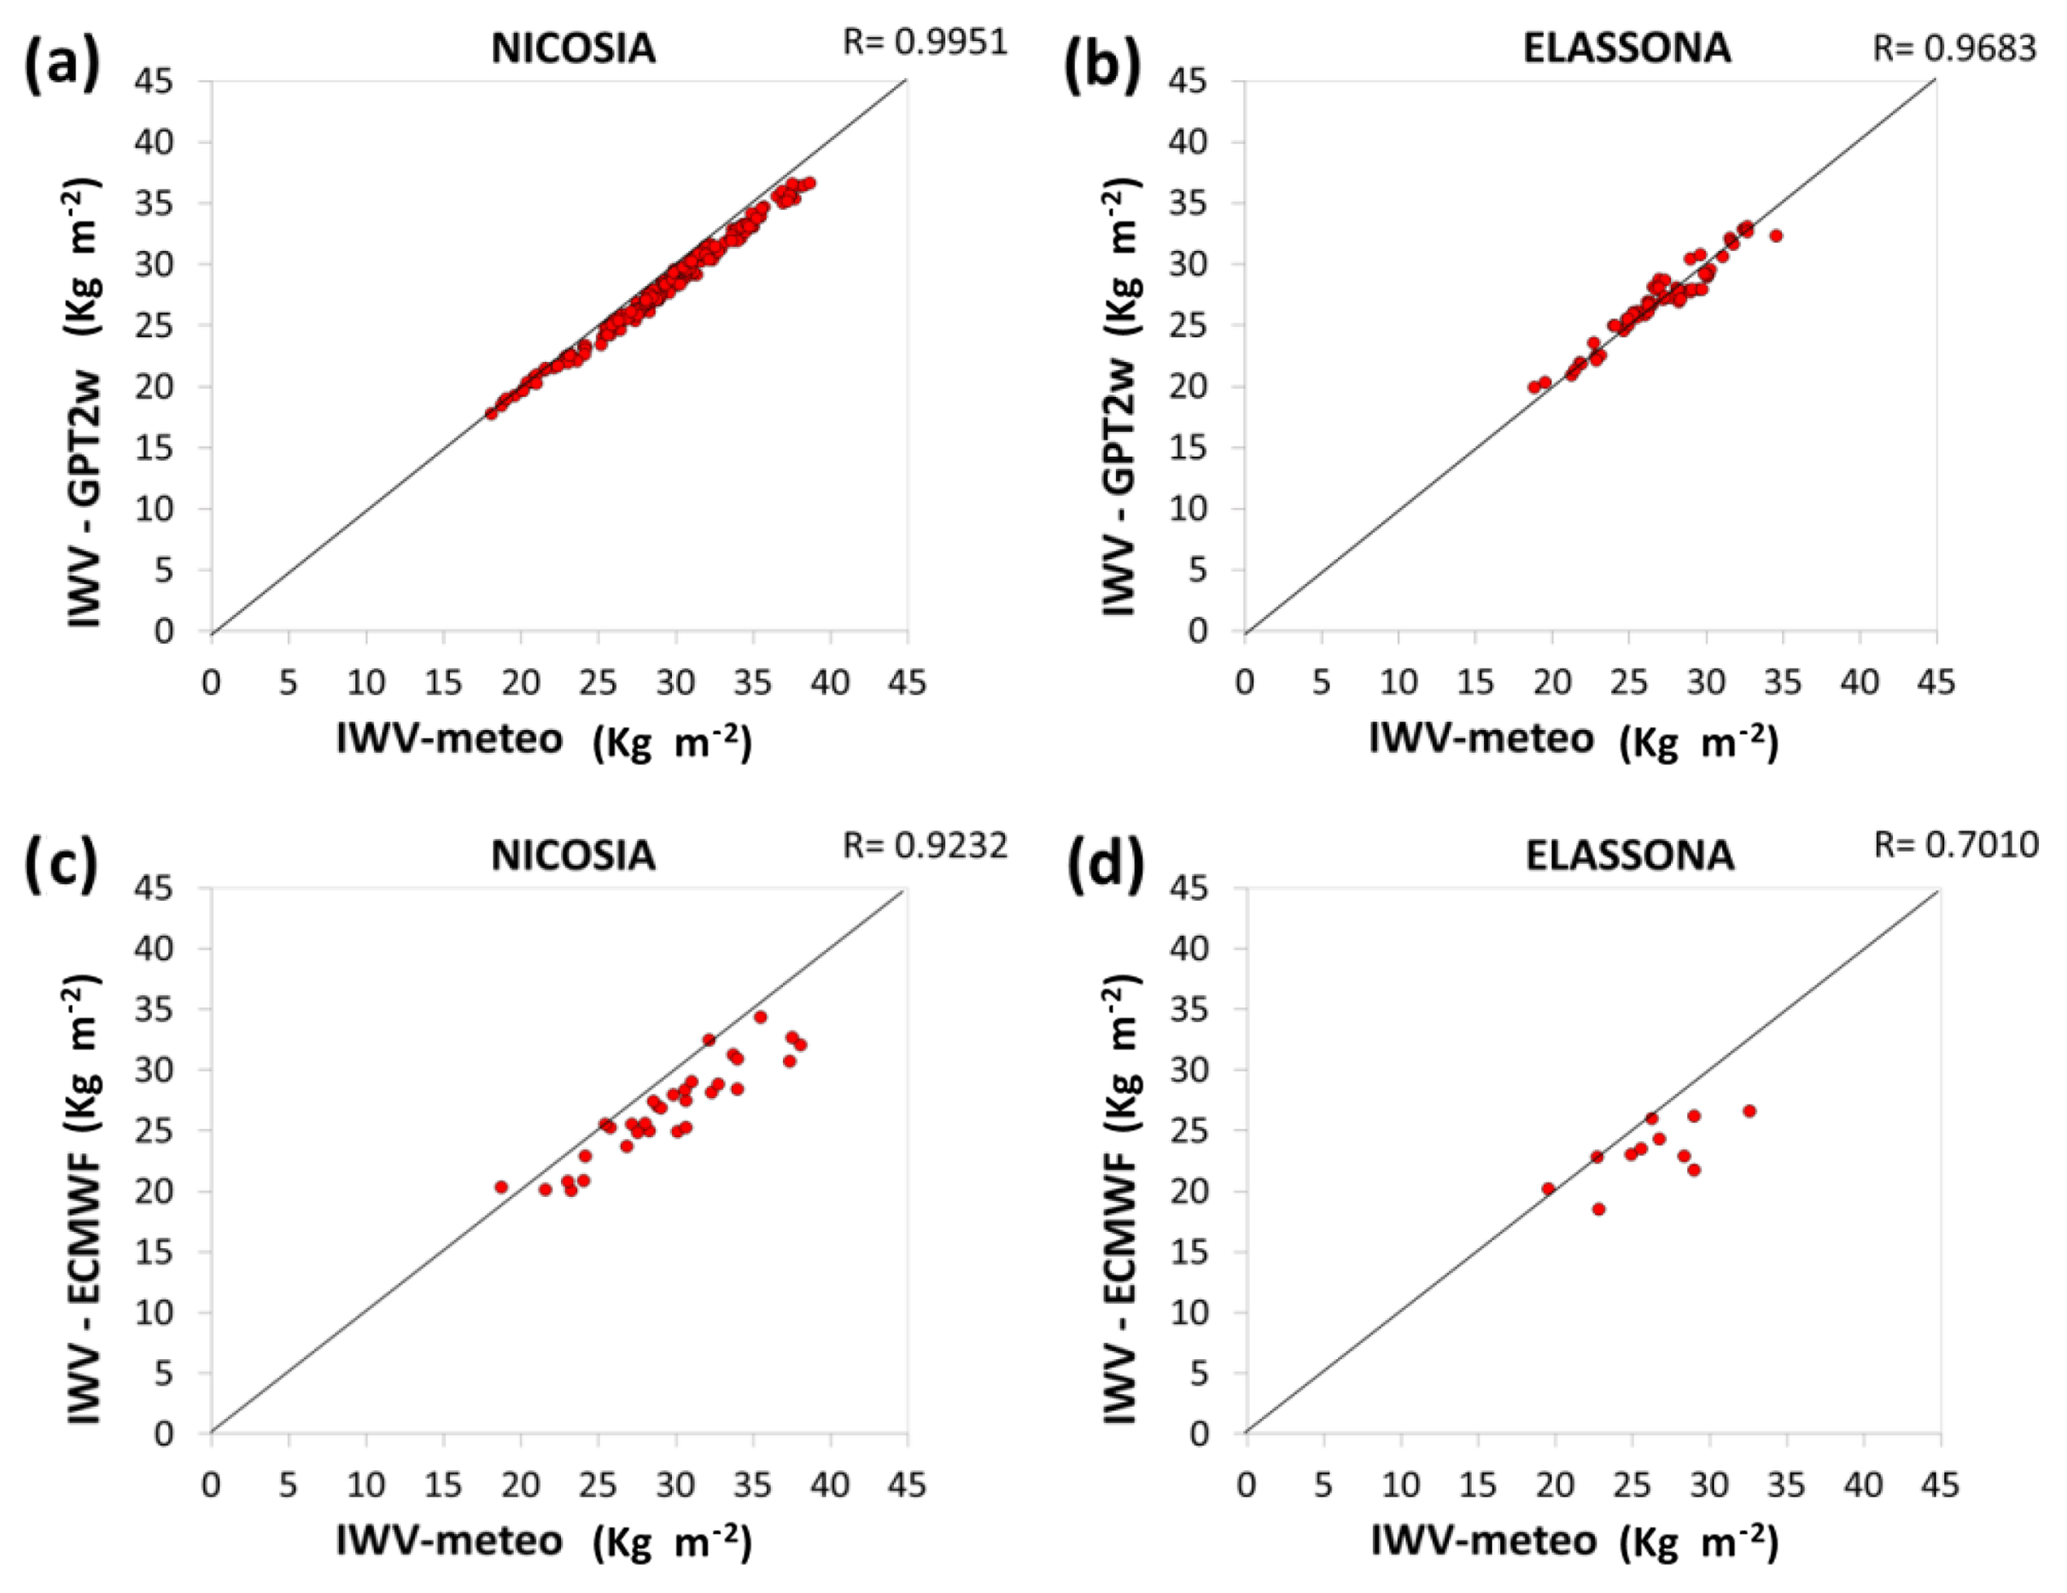
Figure 5Scatter plots of IWV computed from GNSS receivers by using surface T, P from collocated meteorological stations with IWV computed from GNSS receivers by using (1) GPT2w model (upper panels) and (2) ECMWF model (lower panels) for Nicosia (a, c) and Elassona (b, d) sites. Black diagonal lines represent R=1. The number of points (red dots) used for the analysis are N=12 and N=32 for Elassona and Nicosia sites, respectively.
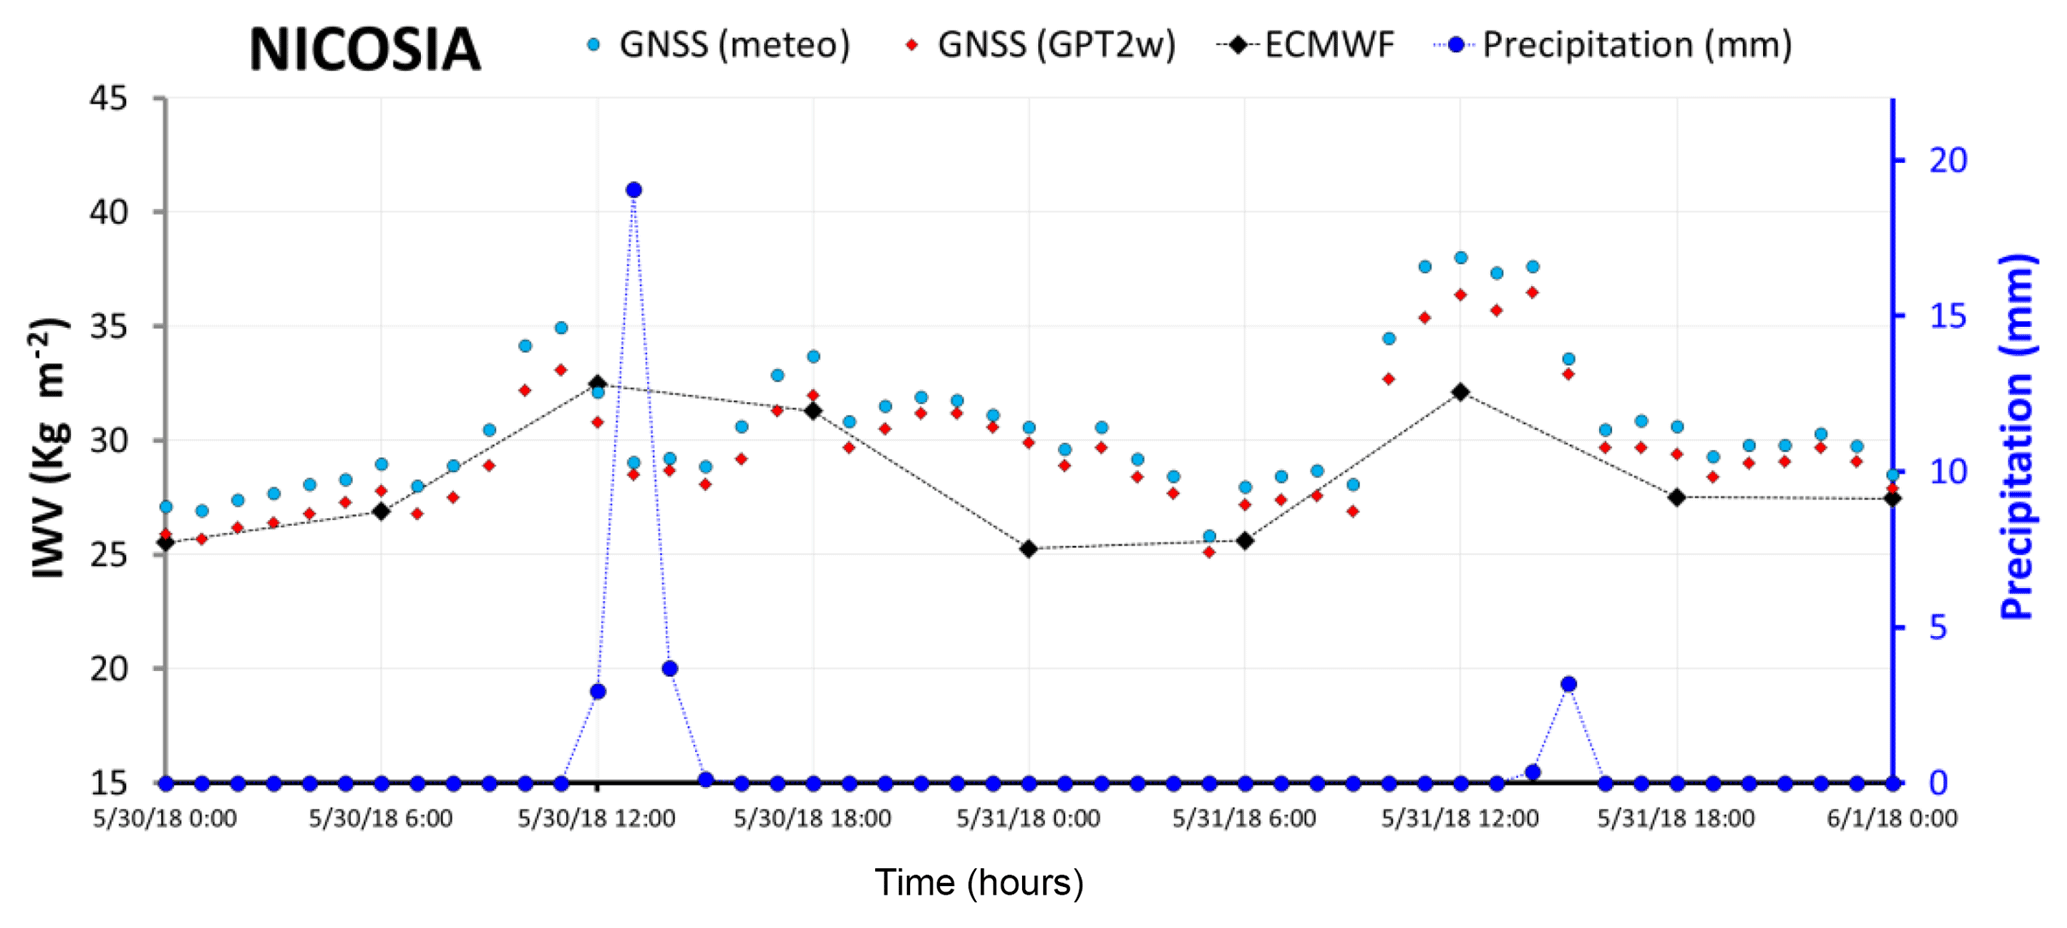
Figure 6Variations of IWV and Precipitation (dark blue dots) over Nicosia station during 30 and 31 May 2018. Light blue dotted line represents the GNSS-derived IWV by using in situ meteorological observations. A red dotted line corresponds to GNSS-derived IWV by using GPT2w model and black dotted line is the IWV calculated from ECMWF model.
The evaluation of GPT2w accuracy in terms of predicting surface atmospheric variables (pressure and temperature) and the associated GNSS tropospheric products ZHD and ZWD reveals that the model performs in general very well during the period under examination, apart from the case of temperature computation where considerable discrepancies are found between modelled and measured values in both stations and mainly at Elassona. The temperature at a certain site is calculated by the GPT2w model by linearly extrapolating the model temperature values from the heights of the four closest to the station grid nodes to the height of the station. In the dry hydrostatic mapping function, a height correction is applied, while in the wet mapping function there is no height correction (Böhm et al., 2014). This fact along with the consideration that the ETOPO5 topography employed by GPT2w model has a horizontal grid (which in the case of Elassona site includes an extended mountainous region characterised by large height differences – up to about 1.7 km) may induce the observed high temperature differences between real and modelled values. In the case of the island of Cyprus, the increased temperature deviations can be ascribed to the fact that the terrain differences (sea-land) are not adequately represented by the coarse spatial resolution. Height correction is also applied by GPT2w to derive the pressure at the desired station, however, the deviations of the modelled from the pressure values are not significant in both stations.
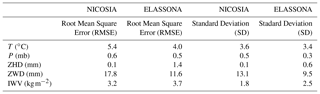
The GPT2w model exhibits high effectiveness in terms of reproducing GNSS integrated water vapor in both sites during the period under investigation. As illustrated in Fig. 2, the IWV retrieved from GNSS by using GPT2w model atmospheric variables (T, P) is in high compliance with the one retrieved from GNSS by using T, P obtained from the collocated meteorological stations. Their absolute (relative percentage) biases are very low, not exceeding the values of 2 kg m−2 (6 %) in both stations (Fig. 3). The considerable capability of the GPT2w model to reproduce IWV is further evidenced by the RMSE and standard deviation values which are very low in both stations (Table 1). In particular, the RMSE of IWV is 1.2 and 0.9 kg m−2 which correspond to 0.12 and 0.09 cm of PWV for Nicosia and Elassona sites respectively. These values are close to the accuracy of PWV estimated as 0.07 cm over a GNSS receiver operational network at Central Italy (Bonafoni et al., 2013). IWV calculated by employing ECMWF (IFS) model is also compared with the GNSS-derived IWV estimated by using in situ meteorological observations and noticeable deviations are sometimes found as much as 7 kg m−2, in both stations, underlying the impact of applying different methods in IWV estimation (Figs. 3 and 4). This inconsistency is also demonstrated in Fig. 5 where IWV computed from GNSS receivers by using GPT2w model and IWV calculated from ECMWF model are compared to IWV provided from GNSS receivers by using in situ meteorological observations by means of scatter diagrams. In Table 2, the RMSE and Standard Deviation of these deviations are shown which are relatively low and close to those corresponding to GPT2w-derived parameters, except from ECMWF-derived ZWD which presents lightly greater RMSE and standard deviations in both sites and mainly in Nicosia.
Table 2The RMSE of absolute bias and Standard Deviations (a) between in situ meteorological observations and ECMWF (IFS) model values of T, P and (b) between parameters (ZHD, ZWD, IWV) obtained by using ECMWF (IFS) model and the respective ones retrieved from GNSS observations by using T, P obtained from in situ meteorological stations, for both stations during the period of study.
The IWV variations are also examined in relation to rainfall variations during the days of thunderstorm in Nicosia (30 and 31 May 2018). In Fig. 6, the IWV derived by using the three different approaches and precipitation are plotted on an hourly basis for the 2-day period. As seen, abrupt precipitation is noted between 12:00–15:00 UTC on 30 May and around 15:00 UTC on the next day, while the IWV sharply increases prior to both precipitation maxima. This is in accordance with Benevides et al. (2015) who found that the most intense precipitation events occur after steep ascents in precipitable water vapour (PWV) by investigating a number of extreme precipitation cases in the period 2010–2012 at Lisbon with the aid of GNSS derived PWV data. Similarly, a sharp increase of PWV contents before raining was identified by Yao et al. (2017) by using GNSS-derived PWV for a two year period over Zhejiang station. Various studies have been conducted to assess the possibility this relationship of PWV with rainfall to be utilized for nowcasting prediction of precipitation (Cao et al., 2016; Haase et al., 2003). It has been shown that the inclusion of GNSS-retrieved water vapour data into numerical weather models improves the forecasting of sudden and severe precipitation events (Vedel et al., 2004).
In this investigation, the suitability of using GPT2w empirical model, and ground meteorological data in retrieving zenith tropospheric delay and atmospheric integrated water vapor from ground-based GNSS observations over two sites of the permanent stations network of Cyprus and Greece is evaluated during the period 27 May to 3 June 2018 which was characterised by almost daily abrupt heavy precipitation at midday in the Cyprus station (Nicosia) and by fair weather conditions in the Greek station (Elassona). The results are also compared with IWV calculated by ECMWF's IFS operational model. The capability of GPT2w and ECMWF models in reproducing surface atmospheric variables (temperature, pressure) is assessed as well. It is found that both models perform quite well and in particular over Nicosia when used for the retrieval of ZWD and IWV while considerable deviations between GPT2w-derived and ECMWF-computed IWV are recorded illustrating the possible impact of different methods on IWV estimation. ZHD and pressure are more precisely calculated from the ECMWF model as compared to GPT2w-derived values. As shown, temperature comprises the largest source of error in the determination of integrated water vapor from GNSS observations which is mainly induced by the coarse representation of the orography and terrain by the GPT2w model. The temperature bias of ECMWF-derived IWV can be also attributed to the incomplete representation of the topography by the model. The quality of the meteorological data assimilated into the numerical model, as well as the various model parameterisations, may have a substantial effect on IWV values. Although significant improvements to the model's topography have been made, further investigation is required to eliminate such discrepancies. A rapid rise of IWV few hours prior to the sudden rainfall events during noontime on 30 and 31 May over Nicosia was also revealed. Bearing in mind that within the framework of BeRTISS project new accurate meteo-sensors will be installed soon at the same place with the existing permanent GNSS receivers of the networks of Cyprus and Greece, the authors intend to conduct the same method of analysis at the newly installed stations and for a longer time interval during both severe and normal weather conditions in order to derive more concrete conclusions with regard to the models' accuracy and feasibility in retrieving tropospheric delays and precipitable water.
Since this study is conducted in the frames of the ongoing BeRTISS project in which most of the authors are participating (Christina Oikonomou, Christos Pikridas, Kyriakos Balidakis, Filippos Tymvios and Haris Haralambous), the underlying research data will be provided through direct contact with the authors via e-mail. As soon as the BeRTISS database will be constructed, the data will be deposited at this database. For additional information please contact the Project Coordinator Haris Haralambous (contact address: eng.hh@frederick.ac.cy).
This paper is the outcome of collaborative teamwork. CO contributed to the conceptualization, development of the methodology, analysis of results, visualization of outputs and writing of the paper. CP contributed to the conceptualization, development of the methodology for the analysis of the data and writing of the paper. SB and CP contributed to the retrieval of IWV, ZHD, and ZWD and the writing of the paper. KB contributed to the calculations of IWV using the ECMWF (IFS) numerical prediction model and the writing of the paper. FT and DC contributed with the processing and validation of the meteorological observations and the writing of the paper. SM and HH contributed to the writing, editing and review of the paper. All authors read and approved the final manuscript.
Silas Michaelides is the Guest Editor of the Special Issue.
This article is part of the special issue “Earth surveillance and space-based monitoring of the environment: integrated approaches”. It is a result of the EGU General Assembly 2018, Vienna, Austria, 8–13 April 2018.
This paper is conducted in the framework of the BeRTISS project which is
financed by the Transnational Cooperation Programme Interreg V-B
“Balkan-Mediterranean 2014–2020” co-financed by the European Union
(European Regional Development Fund – ERDF) and National funds of the
participating countries.
Edited by: C. Kontoes
Reviewed by: two anonymous referees
Balidakis, K., Nilsson, T., Zus, F., Glaser, S., Heinkelmann, R., Deng, Z., and Schuh, H.: Estimating integrated water vapor trends from VLBI, GPS, and numerical weather models: Sensitivity to tropospheric parameterization, J. Geophys. Res.-Atmos., 123, 6356–6372, https://doi.org/10.1029/2017JD028049, 2018.
Benevides, P., Catalao, J., and Miranda, P. M. A.: On the inclusion of GPS precipitable water vapour in the nowcasting of rainfall, Nat. Hazards Earth Syst. Sci., 15, 2605–2616, https://doi.org/10.5194/nhess-15-2605-2015, 2015.
Bevis, M., Businger, S., Herring, T. A., Rocken, C., Anthes, R. A., and Ware, R. H.: GPS meteorology: Remote sensing of atmospheric water vapor using the Global Positioning System, J. Geophys. Res., 97, 15784–15801, https://doi.org/10.1029/92jd01517, 1992.
Bevis, M., Businger, S., Chiswell, S. R., Anthes, R. A., Rocken, C., and Ware, R. H.: GPS meteorology: Mapping zenith wet delay onto precipitable water, J. Appl. Meteorol., 33, 379–386, https://doi.org/10.1175/1520-0450(1994)033<0379:gmmzwd>2.0.co;2, 1994.
Böhm, J., Niell, A., Tregoning, P., and Schuh, H.: Global Mapping Function (GMF): A new empirical mapping function, Geophys. Res. Lett., 33, L07304, https://doi.org/10.1029/2005GL025546, 2006.
Böhm, J., Heinkelmann, R., and Schuh, H.: Short note: a global model of pressure and temperature for geodetic applications, J. Geodesy, 81, 679–683, https://doi.org/10.1007/s00190-007-0135-3, 2007.
Böhm, J., Möller, G., Schindelegger, M., Pain, G., and Weber, R.: Development of an improved empirical model for slant delays in the troposphere (GPT2w), GPS Solut., 19, 433–441, https://doi.org/10.1007/s10291-014-0403-7, 2014.
Bonafoni, S., Mazzoni, A., Cimini, D., Montopoli, M., Pierdicca, N., Basili, P., Ciotti, P., and Carlesimo, G.: Assessment of water vapor retrievals from a GPS receiver network, GPS Solut., 17, 475–484, https://doi.org/10.1007/s10291-012-0293-5, 2013.
Bruyninx, C.: The EUREF Permanent Network; a multi-disciplinary network serving surveyors as well as scientists, GeoInformatics, 7, 32–35, 2004.
Businger, S., Chiswell, S. R., Bevis, M., Duan, J., Anthes, R. A., Rocken, C., Ware, R. H., Exner, M., VanHofe, H., and Solheim, F.: The promise of GPS in Atmospheric Monitoring, B. Am. Meteorol. Soc., 77, 5–18, https://doi.org/10.1175/1520-0477(1996)077<0005:tpogia>2.0.co;2, 1996.
Cao, Y. J., Guo, H., Liao, R. W., and Uradzinski, M.: Analysis of water vapor characteristics of regional rainfall around Poyang Lake using ground-based GPS observations, Acta Geod. Geophys., 51, 467–479, https://doi.org/10.1007/s40328-015-0137-1, 2016.
Collins, J. P. and Langley, R. B.: A tropospheric delay model for the user of the Wide Area Augmentation System, Final contract report for Nav Canada, Department of Geodesy and Geomatics, Engineering Technical Report No. 187, University of New Brunswick, Fredericton, N.B., Canada, 1997.
Dach, R., Lutz, S., Walser, P., and Fridez, P.: GNSS Software Version 5.2. User manual, Astronomical Institute, University of Bern, Bern Open Publishing, ISBN: 978-3-906813-05-9, https://doi.org/10.7892/boris.72297, 2015.
Davis, J. L., Herring, T. A., Shapiro, I. I., Rogers, A. E. E., and Elgered, G.: Geodesy by radio interferometry: Effects of atmospheric modeling errors on estimates of baseline length, Radio Sci., 20, 1593–1607, https://doi.org/10.1029/rs020i006p01593, 1985.
Duan, J., Bevis, M., Peng, F., Bock, Y., Steven, C., Steven, B., Christian, R., Frederick, S., Terasa H., Randolph, W., Simon, M., and Herring, T. A.: GPS Meteorology: Direct Estimation of the Absolute Value of Precipitable Water, J. Appl. Meteorol., 35, 830–838, https://doi.org/10.1175/1520-0450(1996)035<0830:GMDEOT>2.0.CO;2, 1996.
Fotiou, A. and Pikridas, C.: GPS and Geodetic Applications, 2nd edn., Zitis Publications, Thessaloniki, Greece, 2012.
Giorgi, F.: Climate change hot-spots, Geophys. Res. Lett., 33, L08707, https://doi.org/10.1029/2006GL025734, 2006.
Haase, J., Ge, M., Vedel, H., and Candalais, E.: Accuracy and Variability of GPS Tropospheric Delay Measurements of Water Vapor in the Western Mediterranean, J. Appl. Meteorol., 42, 1547–1568, https://doi.org/10.1175/1520-0450(2003)042<1547:AAVOGT>2.0.CO;2, 2003.
Krueger, E., Schuler, T., and Arbesser-Rastburg, B.: The Standard Tropospheric Correction Model for the European Satellite Navigation System Galileo. Proc. General Assembly URSI, New Delhi, India, available at: https://www.researchgate.net/profile/Bertram_ArbesserRastburg/publication/252717445_THE_STANDARD_TROPOSPHERIC_CORRECTION_MODEL_FOR_THE_EUROPEAN_SATELLITE_NAVIGATION_SYSTEM_GALILEO/links/00b4952c318413b26d000000.pdf (last access: June 2018), 2005.
Lagler, K., Schindelegger, M., Bohm, J., Krasna, H., and Nilsson, T.: GPT2: Empirical slant delay model for radio space geodetic techniques, Geophys. Res. Lett., 40, 1069–1073, https://doi.org/10.1002/grl.50288, 2013.
Liu, J., Chen, X., Sun, J., and Liu, Q.: An analysis of GPT2/GPT2w+Saastamoinen models for estimating zenith tropospheric delay over Asian area, Adv. Space Res., 59, 824–832, https://doi.org/10.1016/j.asr.2016.09.019, 2017.
Mendes, V. B., Prates, G., Santao, L., and Langley, R. B.: An evaluation of the accuracy of models for the determination of weighted mean temperature of the atmosphere, Proc. ION 2000, National Technical Meeting, Anaheim, CA, USA, 433–438, 2000.
Moore, A. W., Small, I. J., Gutman, S. I., Bock, Y., Dumas, J. L., Fang, P., Haase, J. S., Jackson, M. E., and Laber, J. L.: National Weather Service Forecasters Use GPS Precipitable Water Vapor for Enhanced PART B – TECHNICAL ANNEX 7 Situational Awareness during the Southern California Summer Monsoon, American Meteorological Society, https://doi.org/10.1175/BAMS-D-14-00095.1, 2015.
Olalekan, I., Ludwig, C., and Joel, B. O.: A Presentation at the United Nations /Russian Federation Workshop on the Applications of GNSS, 18–22 May 2015, Krasnoyarsk, Russian Federation, available at: http://www.unoosa.org/documents/pdf/psa/activities/2015/RussiaGNSS/abstracts.pdf (last access: June 2018), 2015.
Pikridas, C., Katsougiannopoulos, S., and Zinas, N.: A comparative study of zenith tropospheric delay and precipitable water vapor estimates using scientific GPS processing software and web based automated PPP service, Acta Geod. Geophys., 49, 177–188, https://doi.org/10.1007/s40328-014-0047-7, 2014.
Rahimi, Z., Shafri, H. Z. M., Othman, F., and Norman, M.: Effect of tropospheric models on derived precipitable water vapor over Southeast Asia, J. Atmos. Solar-Terr. Phy., 157–158, 55–66, https://doi.org/10.1016/j.jastp.2017.02.011, 2017.
Rózsa, S.: Uncertainty considerations for the comparison of water vapour derived from radiosondes and GNSS, in: Earth on the Edge: Science for a Sustainable Planet, edited by: Rizos, C. and Willis, P., International Association of Geodesy Symposia, Springer, Berlin, Heidelberg, 139, 65–78, https://doi.org/10.1007/978-3-642-37222-3_9, 2014.
Saastamoinen, J. J.: Contributions to the Theory of Atmospheric Refraction, Bulletin Géodésique, 105, 279–298, https://doi.org/10.1007/BF02521844, 1972.
Shoji, Y., Kunii, M., and Saito, K.: Mesoscale data assimilation of Myanmar cyclone Nargis. Part 2: assimilation of GPS derived precipitable water vapor, J. Meteorol. Soc. Jpn., 89, 67–88, https://doi.org/10.2151/jmsj.2011-105, 2011.
Vedel, H., Huang, X. Y., Haase, J., Ge, M., and Calais, E.: Impact ofGPS zenith tropospheric delay data on precipitation forecasts in Mediterranean France and Spain, Geophys. Res. Lett., 31, 2004, https://doi.org/10.1029/2003gl017715.
World Meteorological Organization: Guide to Meteorological Instruments, and methods of Observation, Chapter 1, available at: https://library.wmo.int/opac/doc_num.php?explnum_id=3179 (last access: June 2018), 2010.
Yao, Y., Shan, L., and Zhao, D.: Establishing a method of short-term rainfall forecasting based on GNSS-derived PWV and its application, Sci. Rep.-UK, 7, 12465, https://doi.org/10.1038/s41598-017-12593-z, 2017.
Zus, F., Dick, G., Douša, J., Heise, S., and Wickert, J.: The rapid and precise computation of GPS slant total delays and mapping factors utilizing a numerical weather model, Radio Sci., 49, 207–216, https://doi.org/10.1002/2013RS005280, 2014.