 | 21 Aug 2018
3-D Simulations of Groundwater Utilization in an Urban Catchment of Berlin, Germany
Nasrin Haacke
Magdalena Scheck-Wenderoth
Michael Schneider
Mauro Cacace
The objective of this study is to analyze the influence of groundwater pumping on predicted groundwater circulation below the urban center of Berlin, Germany, by 3-D numerical models. Of particular interest are hydraulic head distributions, the related shallow-deep groundwater interactions and their scale dependency within an anthropogenically overprinted environment. For this purpose, two model scenarios are investigated. In the first model realization (Model 1), the effects of groundwater pumping are implemented by imposing a fixed, though spatially variable, hydraulic head distribution over the whole model area, therefore implicitly taking into account the effects of pumping activities. In the second model realization (Model 2), these effects are considered in an explicit manner by imposing variable production rates in locations where pumping activities are ongoing.
The results of this study show, that both models predict similar hydraulic head distributions on the regional scale (i.e. urban wide). Locally, differences in the extent, volume and depth of emerging depression cones can be observed. This is manifested in differences in predicted fluid flow patterns supporting or refuting the possibility of contaminant transport in an area of importance for groundwater production (Lower Havel). Herein, the second model approach outlines the necessity of implementing wells as an active parameter to reproduce observed fluid pathways.


The aim of this study is to investigate the effects of groundwater pumping wells on the regional shallow to deep groundwater dynamics in a densely populated area, as exemplified by the capital of Germany, Berlin. For this purpose we created two model scenarios, each depicting a different set of hydraulic upper boundary conditions.
In detail, in Model 1 (M1 hereafter) we apply a fixed in time hydraulic head distribution (first order boundary condition) over the whole spatial extent of the model domain. The hydraulic head distribution has been derived from previous studies (Frick et al., 2017) and takes into account, though implicitly, the secondary effects related to pumping activities on the surface to subsurface hydraulics. In a second model realization (M2 hereafter) the effects of pumping activities on the groundwater dynamics have been implemented in a more realistic manner by explicitly integrating production wells with variable rates as active boundary conditions in the model. The initial state, that is, the “natural state” before commissioning of the wells has been derived based on the assumption that surface hydraulic features as represented by major lakes and rivers can be considered as representing preferential discharge areas characterized by the lowest hydraulic potentials. The reliability of this working assumption is tested by quantifying the ability of this second model set up to provide a first order representation of the regional and local subsurface hydraulic field as constrained by available hydraulic data (as implemented in M1).

Figure 1Topography of the model area. Small black box = Lower Havel site, red line = political border of Berlin, black outlines = surface water bodies, black dots = hydraulic head measurement positions, triangles = well positions: blue = active, white = inactive, bright green outline = sewage farm Karolinenhöhe (KH), 1 = Lake Tegel. m a.s.l. = meter above sea level. Coordinates are in Gauß-Krüger DHDN Zone 4. Database supplied by Senate Department for Urban Development and the Environment of Berlin (SenStadtUm), Ministry of Rural Development, Environment and Agriculture of the Federal State of Brandenburg (MRDEA) and the Waterways and Shipping Office (WSA).
The results from the modeling exercise are analyzed both regarding the regional (urban wide) and local characteristics. On the regional scale we discuss and quantify the reliability of computed groundwater dynamics to capture first order aspects of the observed hydraulic head trends over the whole model area. On a more local scale, we focus on a specific area of interest as represented by the Lower Havel, a lake-like lowland river in the west of Berlin (Fig. 1). The Lower Havel has been chosen because of recent measurements demonstrating increasing amounts of pollutants nearby active wells (Galleries Rupenhorn and Schildhorn in Figs. 1 and 2), the origin of which is still under debate. It is likely that pollution of the groundwater might originate from a nearby sewage farm (Karolinenhöhe, KH in Figs. 1 and 2) located on the western side of the river, which has been active for more than 100 years (Hasch, 2014). In addition, an undercurrent river connection between the sewage farm and the well galleries has also been proposed in previous studies (Jarmersted, 1992). In order to test these hypothesis, we include an additional component of non-reactant contaminant transport in the model and investigate to which degree the hydrodynamics of these contaminants are affected by the hydrogeological setting and the local groundwater circulation as overprinted by anthropogenic activities. Understanding the aforementioned dynamics is of specific relevance for the area under investigation, given the fact that the city of Berlin produces all of its drinking water supply on wells utilizing groundwater resources within the limits of the urban area, where inflowing groundwater and bank infiltration represent the major constituents (Möller and Burgschweiger, 2008).
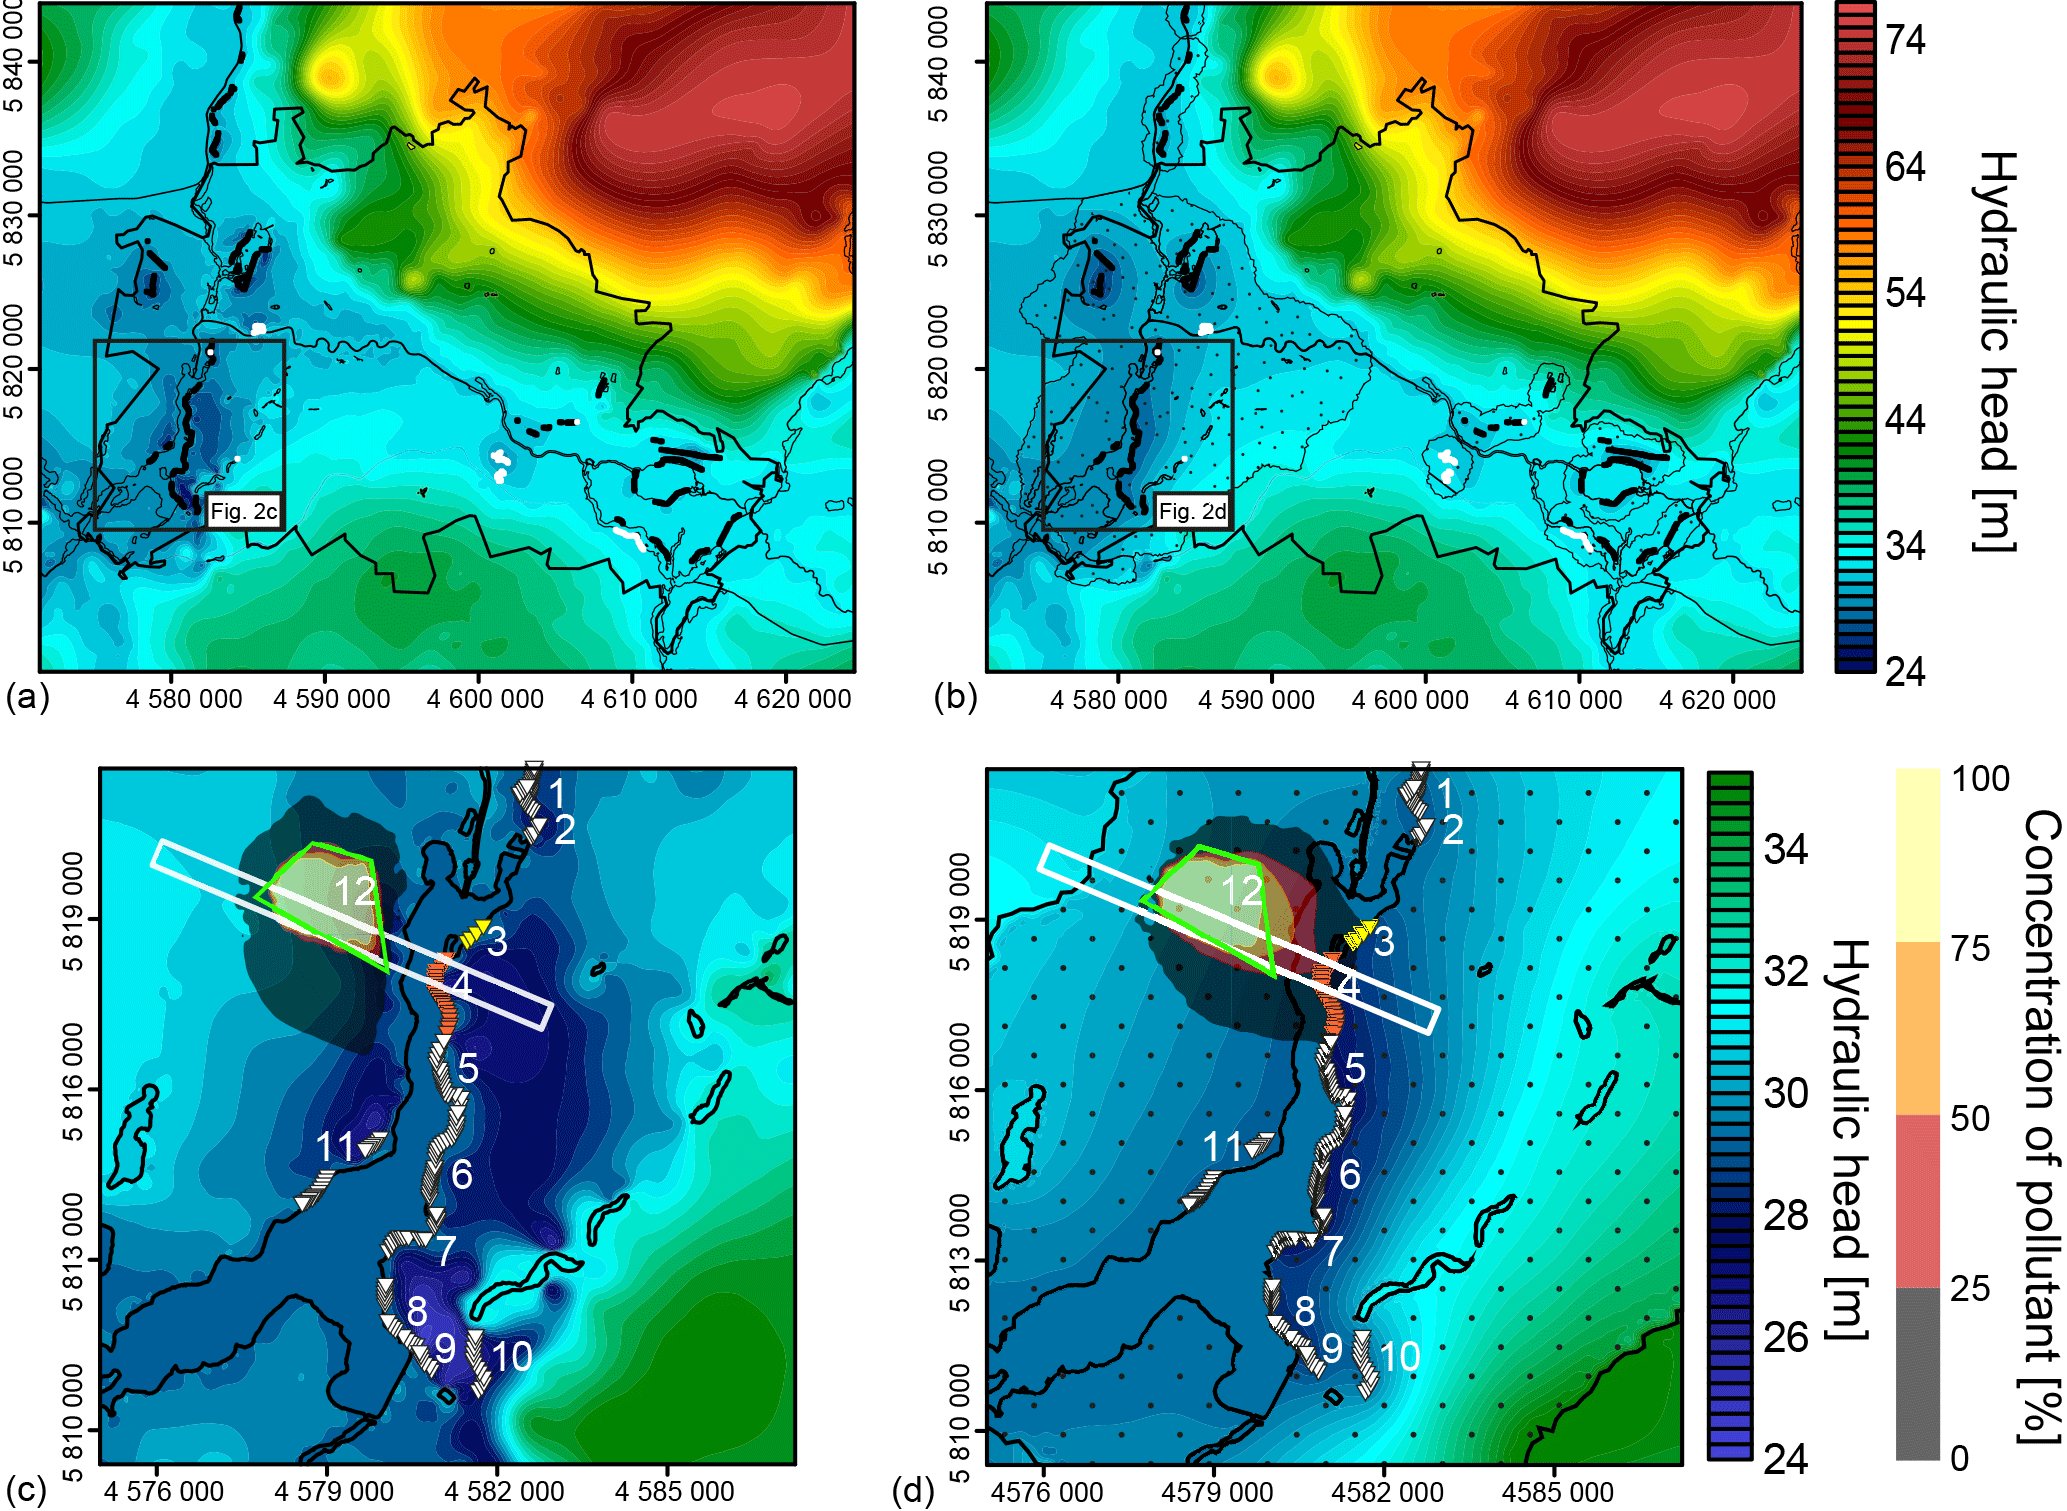
Figure 2Regional and local distribution of hydraulic heads for M1 and M2. (a, b) Hydraulic head distribution for entire model area for (a) M1 and (b) M2, black dots = active wells, white dots = inactive wells. (c, d) Hydraulic head distribution for Lower Havel for (c) M1 and (d) M2, triangles = implemented wells: yellow = Rupenhorn, orange = Schildhorn, white = further (Table 2); white box = extent of Fig. 3; green outline = sewage farm KH. (b, d) Dotted area represents extent of depression cones induced by pumping wells used for hydraulic boundary condition setup of M2; Colored plumes represent areas of increased concentration (lower threshold 1 g L−1) of saline water.
The 3-D structural model used here, is based on the study of Frick et al. (2016). It differentiates 20 geological units, 8 Cenozoic, 8 Mesozoic and 2 Paleozoic, for the sedimentary succession and 2 units for the underlying basement.
The presented Mesozoic sediments are mainly composed of consolidated clastics, carbonates and sandstones with clay and silt. However, the Middle Muschelkalk consists of evaporites, thereby representing an aquitard. The overlying Cenozoic sediments are predominantly composed by unconsolidated clastics (Frick et al., 2016) which contain the main shallow aquifer system utilized for the water supply of Berlin (Limberg and Thierbach, 2002). This upper aquifer system has a total thickness of 150 m and can be subdivided into four different aquifers, with the second aquifer regarded as the most important (Limberg and Thierbach, 1997). The upper fresh water aquifers are separated from the lower brackish to saline aquifers by the Rupelian aquitard, a clay-rich layer of Oligocene age. Locally, where the sediments of the Rupelian are eroded through incision of glacial channels, a hydraulic connection between both aquifer systems is possible (Limberg and Thierbach, 1997, 2002). Within the context of the present study, these areas are of particular interest since they might provide preferential pathways for intra-aquifer fluid circulation and related mixing of fresh and saline water as locally enhanced by groundwater production from existing active drinking water wells.
3.1 Hydrogeological model
3-D coupled fluid, heat and mass transport simulations have been carried out relying on the commercial software FEFLOW©. The base hydrogeological model resolves the geological subsurface as well as the surface hydrology, including major lakes and rivers.
In comparison to earlier models (Frick et al., 2017), we include a colmation layer as a 1 m thick layer at the base of the surface water bodies, thinning out towards the shoreline. As based on previous analysis (Beyer and Banscher, 1975; Karpf, 2012), this layer is assumed to be mostly impermeable, being composed of organic matter and fine grained sediments of the riverbed. In order to parametrize this layer, we relied on a previous sensitivity analysis (Haacke, 2018) where the range of variations of the permeability have been constrained by laboratory test data (Schälchli, 1993) and field measurements (Beyer and Banscher, 1975; Ingerle, 1991). The best fitting value here corresponds to the characteristics of the Oligocene Rupelian (Frick et al., 2016).
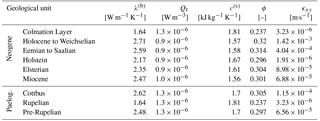
Table 1Properties of the geological units as used for the calculations. Properties of Cretaceous and older units after Sippel et al. (2013). c(s) = heat capacity of solid, ϕ = porosity, κ = hydraulic conductivity, Qr = radiogenic heat production, λ(b) = bulk thermal conductivity; Values were derived from Das (2013); Devlin (2015); Norden and Förster (2006); Norden et al. (2012); Otto (2012); Sippel et al. (2013); VDI (2010).
The horizontal resolution of the model is on average 10 × 10 m. In detail, surface water bodies were discretized in accordance with their respective shape to ensure their precise representation in the models. Each geological unit (20 in total) was subdivided into at least two computational layers to guarantee a good vertical to horizontal element size ratio. The implementation of a colmation layer in the structural and numerical models leads to a total of 57 computational layers with ∼ 33 000 000 elements.
The derived geological model was imported into FEFLOW© to solve for fluid flow and heat and non-reactant mass transport. Details about the mathematical background can be found in Diersch (2014). Mass transport in all models was realized by simulating saturated saline water (345 g L−1) as a proxy for poorly absorbing and adsorbing substances by means of a constant mass concentration boundary condition limited to the extent of the sewage farm KH (Fig. 2). The set of boundary conditions for the temperature consists of: (i) A spatially variable temperature distribution at the surface as derived from the long term average annual temperature data (Senate Department for Urban Development and Housing, 2001) ranging from 7 up to 10 ∘C with local maxima in the center of the model area (Frick et al., 2018a). (ii) A fixed temperature distribution at the base of the model as derived from a previously published study by Noack et al. (2010), which shows variations from 196 to 220 ∘C gradually increasing from northwest to southeast. Given that the topic of the study is to test the sensitivity of the model results to different sets of surface hydraulic boundary conditions, their description is detailed in the following paragraph.
The parametrization of all Cenozoic units is listed in Table 1. To reproduce sufficiently large flow rates in the vicinity of well localities it was necessary to increase the hydraulic conductivity of the Cenozoic units compared to earlier studies (Frick et al., 2017). However, the resulting values are considered to be realistic as they lie well within literature values reported in this region (Limberg and Thierbach, 2002; Norden, 2011). In addition, an anisotropy ratio of 10:1 () was taken into account. All lateral boundaries are closed to both, fluid and heat flow. For fluid flow, this assumption is supported by the location of the region in the middle of the North German plain. Here, no mountainous terrain is adjacent and therefore cross-boundary flow is likely to be very small and was neglected in this study.
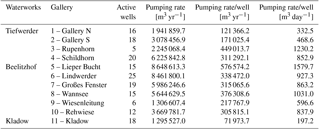
Table 2Pumping rates of the wells implemented in M2 for the local study site. Pumping rate = average (2005–2014), Pumping rate/well = Pumping rate gallery/number of wells.
3.2 Model scenarios
To investigate the effects of groundwater pumping wells on the regional shallow to deep groundwater dynamics, two different model scenarios have been simulated, each featuring a different set of hydraulic boundary conditions. They both have in common that all lateral boundaries are closed to fluid, heat and mass transport. We apply this approach since constraints on cross boundary flow are not available and the study areas location in the middle of the North German plain where no mountainous regions are at the borders, likely linking to very small, negligible, cross-boundary flow.
The first model scenario (M1) depicts a setting, where the hydraulic head boundary condition is based on measured groundwater head (Figs. 1 and 2a) and surface water level data (Fig. 2a) which have been implemented as fixed hydraulic head boundary condition across the entire model area. Thus, M1 includes the effects of present day water production, though implicitly. Accordingly, extensive depression cones induced by pumping activities can be observed in several locations, most prominently at Lake Tegel and the Lower Havel (Fig. 2a). These have been shown to lead to drastic modifications of the local fluid flow regime (Frick et al., 2017). For the simulation run, the pressure and temperature initial conditions for M1 were derived by solving for heat and fluid transport decoupled in steady state. The model was then solved for coupled fluid and heat transport in transient until reaching quasi-steady-state conditions after ∼275 kyrs final simulation time. The resulting pressure and temperature distribution was used to finally solve for mass transport for a simulation time of 100 years, which is the time period of irrigation of treated sewage water.
The second model scenario (M2) utilizes a different setup of the hydraulic boundary condition. Here, the natural distribution of the hydraulic heads and temperature before commissioning of the wells was used as an initial condition. In detail, the boundary condition nodes for the extent of anthropogenically influenced areas were removed (Fig. 2b), thus enabling the groundwater table to adjust freely, based on the computed hydraulic potential. These areas were determined by identifying areas where groundwater levels are lower than that of adjacent surface water bodies, indicating lowering through pumping activity (Fig. 2). In a further step, the effect of pumping activities on the groundwater dynamics and the connected contaminant transport as based on available data for the last 100 years of production (Fig. 2c, d) was considered. These were implemented as discrete features with a point-wise sink/source character with fixed flow rates at the bottom for the entire model run (Table 2).
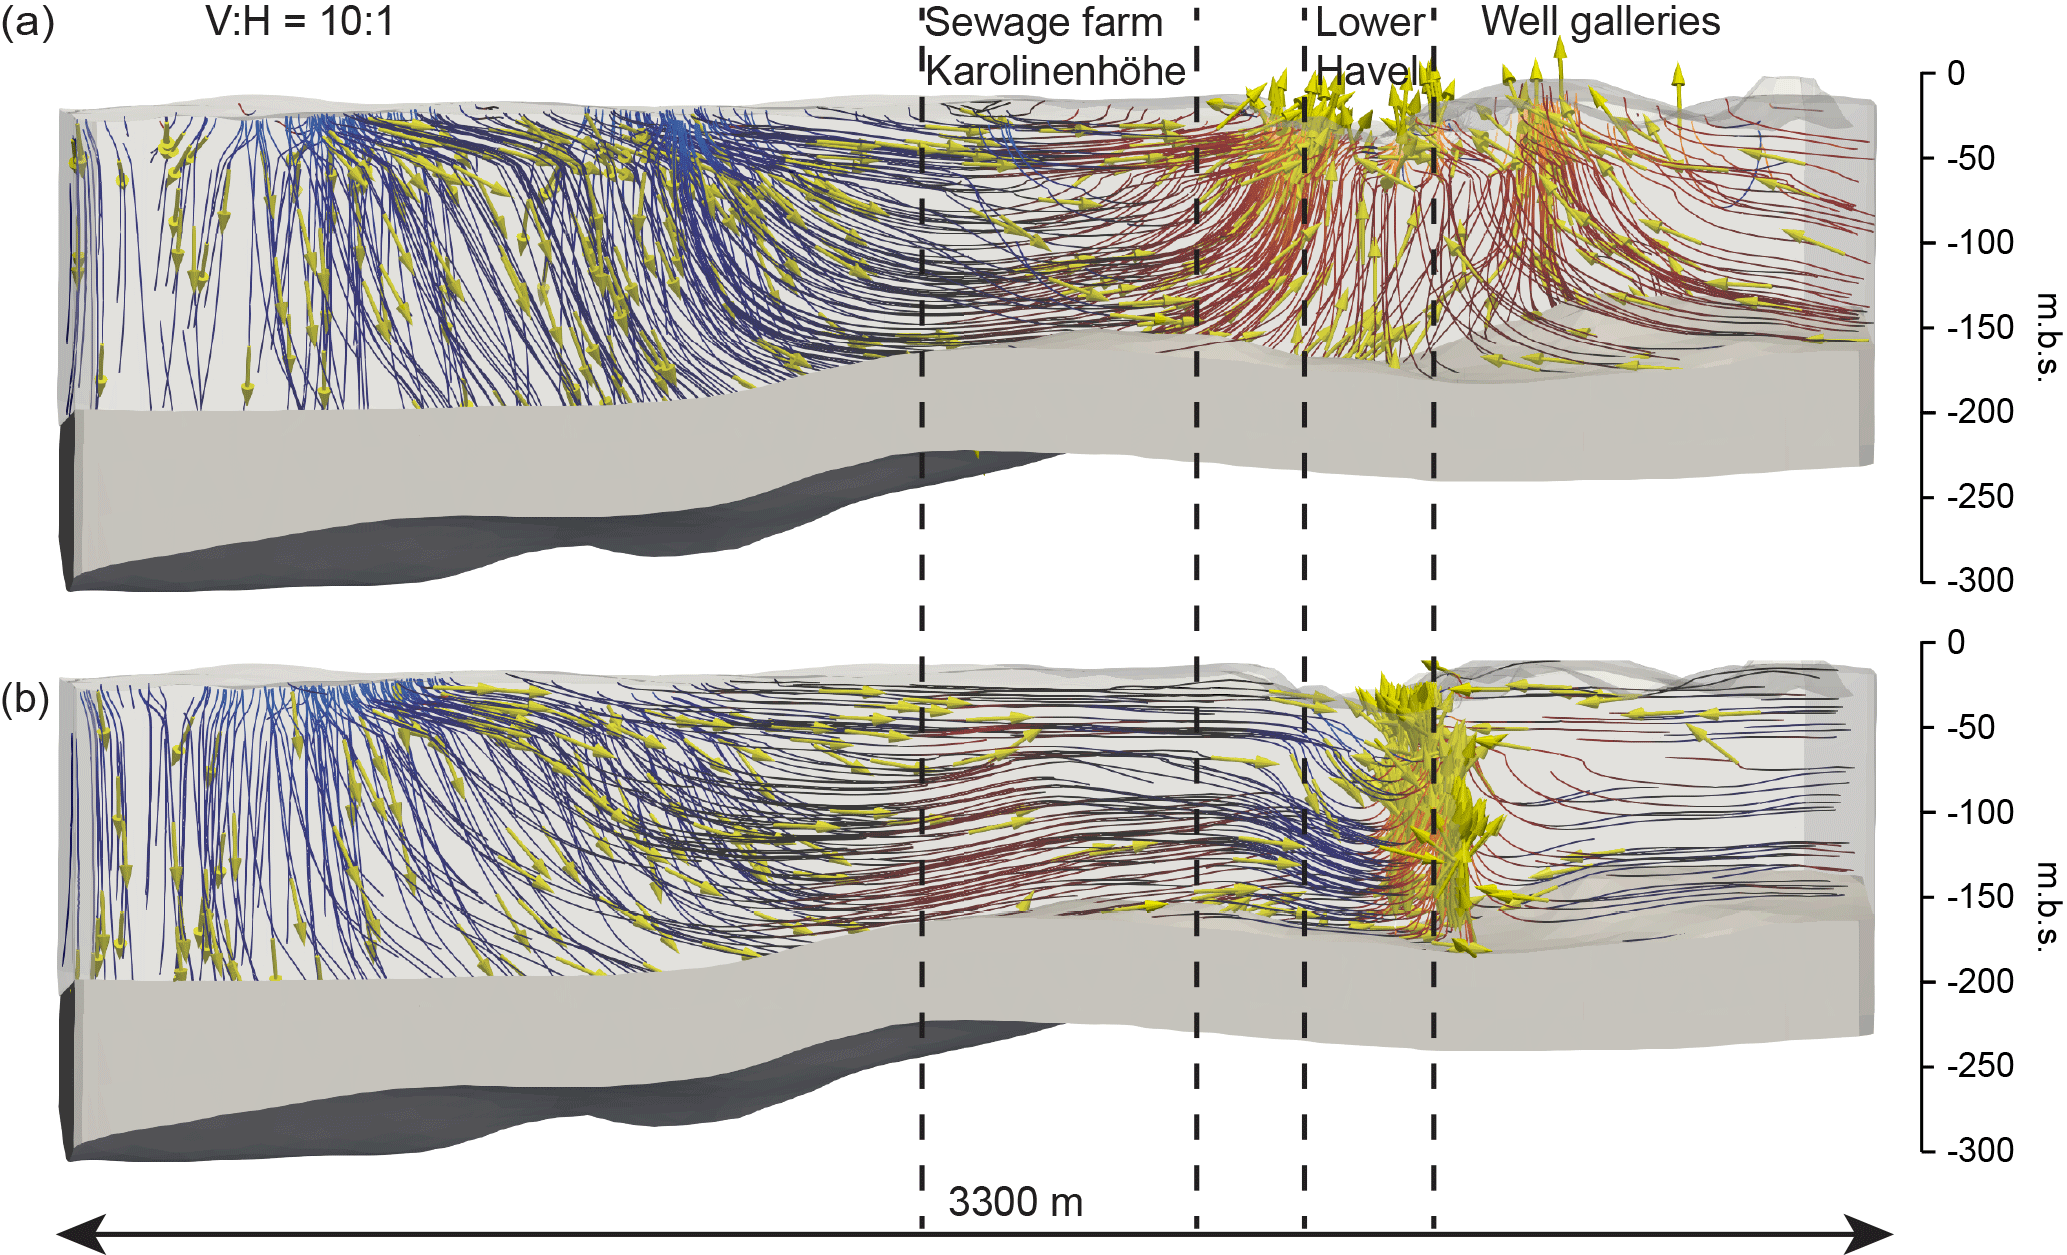
Figure 33-D-cross-section through Lower Havel. Groundwater flow lines in M1 (a) and M2 (b); m b.s. = meters below surface; Colored flow lines represent downwelling (Blue) and upwelling (Red) groundwater calculated with Paraview's stream tracer filter (Squillacote et al., 2007); Yellow arrows = groundwater flow direction; Gray layer = Rupelian unit.
For the results and discussion part, we firstly investigate the regional hydraulic head distribution for the entire model area (Fig. 2a, b) and for the Lower Havel (Fig. 2c, d) for all scenarios. Then we show the results of local fluid dynamics (Fig. 2c, d) along a cross-section (Fig. 3) perpendicular to the river shores of the Lower Havel, parallel to the expected flow direction. We analyze the distributions of modeled hydraulic heads (Fig. 2) with respect to the extent and depth of simulated depression cones. For the local analysis, special focus was given to the well galleries Rupenhorn and Schildhorn on the east bank (Figs. 2c, d and 3).
The hydraulic head distribution for the first model scenario follows the elevation distribution of the model surface quite closely. Maximum hydraulic heads (up to 75.5 m) are observed in the northeast, south and the northwest, where higher than average topographic relief is found (Figs. 1 and 2a). Accordingly, lowest heads (up to 24.7 m) are found in the central model domain, namely the Greater Spree Valley (northwest-southeast striking valley in the center) and large parts of the western model domain, where low topographic relief is encountered (Figs. 1 and 2a). Additionally to this natural relationship, where lakes and rivers normally display discharge areas, anthropogenically overprinted areas are found in the model area, induced by groundwater pumping. These were identified by their respective hydraulic heads being lower than that of the adjacent surface water body level. Most prominently these are located in the western model domain, i.e. near Lake Tegel, in Spandau and for this study most importantly at the Lower Havel and feature an artificial low in hydraulic heads, manifested in the lakes and rivers changing to recharge areas (Fig. 2a, c). The identified overprinted area depicts a horizontal extent of 6.1×10⁸ m2 with maximum drawdown of 5.16 m and a volume of 1.85×10⁸ m3.
The initial condition for model M2 displays a head distribution where anthropogenically induced depression cones have been replenished completely. Hence, lowest elevations in this scenario are 26.5 m whilst highest elevations remain the same (75.5 m). Moreover, all lakes and rivers display discharge areas in this setting, as opposed to results obtained from M1 and M2. The hydraulic head distribution of M2 depicts similar trends to those predicted in M1 which can be seen in the large scale variations (min: 24.7 m, max: 75.5 m, Fig. 2b). Additionally, the maximum drawdown of M2 of 4.17 m as well as the horizontal extent of the depression cones of 5.75×10⁸ m2 follow the results of M1 closely, however, the overall volume of 8.67×10⁷ m3 is considerably smaller. These differences likely derive from comparatively high flow rates towards the well galleries initiated by the hydraulic conductivity setup which supports horizontal flow as opposed to vertical. This regional observation is cross-checked in the following (local regime, Figs. 2c, d and 3).
At the local scale, simulated distributions of hydraulic head for M1 at the Lower Havel show extensive depression cones in the east and west of the Lower Havel (Fig. 2c). Lowest hydraulic potentials can be found in close proximity to the surface water body and range from 24.6 m to the east, near the well gallery Wannsee, to 26.2 m in the west. Furthermore, a connection between the aquifers below the east and west bank is indicated by an extensive depression cone along the west bank likely being the result of pumping at the galleries Rupenhorn and Schildhorn in the east (Fig. 2c). The difference between the water level of the Lower Havel (29.32 m) and the lowest hydraulic potentials leads to influent conditions along the river bank and thus induces the process of bank filtration which is in agreement with observed fluid flow patterns (Möller and Burgschweiger, 2008). In comparison, the hydraulic head distribution predicted by M2 also shows lowest hydraulic potentials of 27.6 m in an extensive depression cone along the east bank of the Lower Havel (Fig. 2d). However, only a less developed depression cone is evident to the west of the Lower Havel. Comparing these model results, differences between the depression cones predicted by the different models become more apparent, wherein, M2 shows a comparatively smaller horizontal extent of the depression cones due to the same reasons as outlined above.
To validate whether the model results obtained in M1 and M2 reproduce observations concerning local pathlines and contaminant transport, we investigated the results for a representative 3-D-cross-section (Fig. 3). Here, a predominantly gravity-driven groundwater circulation in the shallow groundwater system above the Rupelian is predicted for M1, whereby a west-east directed groundwater flow along the pressure gradient dominates, discharging in areas of lowest hydraulic potentials, here represented by the depression cones (Fig. 3a). At these locations, a strong uprising of groundwater shows a significant influence on the advective groundwater flow as a result of pumping activities. These groundwater dynamics would lead to a contaminant transport from the sewage farm KH towards the western shore of the Lower Havel, mainly discharging and accumulating in the depression cone at this location. These results would argue against the hypothesis of a hydraulic connection between the sewage farm KH and the well galleries Rupenhorn and Schildhorn. Instead a southward movement of the contaminants in direction of the depression cones on the west shore is predicted (Fig. 3a). Hence, a static implementation does not allow to capture these proposed fluid flow patterns (Jarmersted, 1992). In comparison, the cross sectional view for M2 (Fig. 3b) also shows a fluid flow pattern dominated by infiltration in the west quickly changing to horizontal flow. This strong component of horizontal flow discharges focused at the east shore of the Lower Havel where the implemented wells are located. Here, a strong undercurrent below the surface water body can be observed. Comparing M1 and M2, a general increase in volumetric flux at well gallery locations (103-fold increase) can be observed for M2, deriving from the hydraulic forcing induced by well pumping. This also suggests, that the influence of groundwater pumping on the resulting groundwater hydrodynamics is only crudely approximated in M1. Additionally, implementing the well galleries as an active parameter in M2 leads to a lateral flow of contaminants, where up to 10–20 % of the initial concentration reaches the well galleries (Fig. 2d) in the time frame of sewage farm activity (Liese et al., 2007). This is also in accordance with the prosed fluid pathlines of Jarmersted (1992).
The model scenarios presented in this study (1) illustrate the influence of groundwater pumping on predicted groundwater circulation, (2) show that pollutant transport depends mainly on the hydraulic forcing and (3) that this natural transport can be accelerated by pumping activities.
Hydraulic head distributions of M2 are generally fitting observations well (regional), however, on the local scale misfits in both lateral extent and overall volume can be observed. This likely derives from comparatively high flow rates towards the well galleries initiated by the hydraulic conductivity setup which supports horizontal flow as opposed to vertical. For the Lower Havel, M2 was found to match observations most closely concerning fluid pathways and contaminant transport, indicating both an undercurrent of the surface water body Lower Havel as well as a pollutant transport in the time framing of the activity of the sewage farm KH (100 years). However, the way pollutant transport is modeled here, represents a strong simplification as dispersion and diffusion values of site-specific contaminants were not considered. This could be investigated in future work as well as including a higher resolution of the hydrogeological subsurface. Furthermore, measured hydraulic head distributions indicate a more complex anthropogenic overprinting than modeled here, hinting at the necessity of implementing time sensitive pumping rates to provide a more reliable base model for groundwater management and sustainability.
The datasets generated during the current study are available from the corresponding author on reasonable request. The database is partly confidential and can therefore not be shared at this point in time. For further information on the model setup and database please refer to Frick et al. (2016, 2018b).
NH and MF constructed the mentioned 3-D models, conducted the coupled simulations, and drafted the manuscript. MSW and MC helped to draft the manuscript. MSW, MS and MC participated in the design of the study and contributed with the discussions and interpretation of the results. All authors read and approved the final manuscript.
The authors declare that they have no conflict of interest.
This article is part of the special issue “European Geosciences Union General Assembly 2018, EGU Division Energy, Resources & Environment (ERE)”. It is a result of the EGU General Assembly 2018, Vienna, Austria, 8–13 April 2018.
This research is funded as part of the joint initiative of the research field
energy of the Helmholtz Association “Energy System 2050”. We would like
to thank the Senate Department for Urban Development and the Environment of
Berlin (SenStadtUm), Berlin waterworks (BWB), Ministry of Rural Development,
Environment and Agriculture of the Federal State of Brandenburg (MRDEA) and
the Waterways and Shipping Office (WSA) for providing the data for this
study. The 3-D information on the structural configuration of the subsurface
of Berlin was compiled, visualized and interpolated with the commercial
software package Petrel (©Schlumberger). We want to thank the
anonymous reviewers for their contributions which helped improve the quaility
of this manuscript significantly.
The article
processing charges for this open-access
publication were
covered by a Research
Centre of the Helmholtz Association.
Edited by: Christopher Juhlin
Reviewed by: two anonymous referees
Beyer, W. and Banscher, E.: Zur Kolmation Der Gewässerbetten Bei Der Uferfiltratgewinnung, Z. Angew. Geol., 21, 565–569, 1975. a, b
Das, B. M.: Advanced Soil Mechanics, CRC Press, New York, NY, USA, 2013. a
Devlin, J.: HydrogeoSieveXL: An Excel-Based Tool to Estimate Hydraulic Conductivity from Grain-Size Analysis, Hydrogeol. J., 23, 837–844, 2015. a
Diersch, H. J.: FEFLOW – Finite Element Modeling of Flow, Mass and Heat Transport in Porous and Fractured Media, Springer, Berlin, Germany, 2014. a
Frick, M., Sippel, J., Cacace, M., and Scheck-Wenderoth, M.: The Geothermal Field Below the City of Berlin, Germany: Results from Structurally and Parametrically Improved 3-D Models, Enrgy. Proced., 97, 334–341, https://doi.org/10.1016/j.egypro.2016.10.011, 2016. a, b, c, d
Frick, M., Scheck-Wenderoth, M., Cacace, M., and Schneider, M.: 3-D Thermohydraulic Modeling of the Coupling of Surface Water Bodies to the Subsurface below the Major Urban Center of Berlin, in: EGU General Assembly Conference Abstracts, vol. 19, p. 14624, Vienna, Austria, 2017. a, b, c, d
Frick, M., Cacace, M., Scheck-Wenderoth, M., and Schneider, M.: Transient Effects of Groundwater Pumping on the 3-D Hydrothermal Configuration of Berlin, in: EGU General Assembly Conference Abstracts, Vienna, Austria, 2018a. a
Frick, M., Scheck-Wenderoth, M., Schneider, M., and Cacace, M.: Surface to Groundwater Interactions beneath the City of Berlin – Results from 3D Models, Geofluids, in press, 2018b. a
Haacke, N.: Numerische 3-D-Modellierung Der Komplexen Hydraulischen Verhältnisse Zwischen Der Unter-Havel Und Angrenzender Grundwasserleiter, Berlin, Master's Thesis, Free University Berlin, Berlin, Germany, 2018. a
Hasch, B.: Nachnutzungskonzept Rieselfelder Karolinenhöhe – Integriertes Gesamptkonzept, Tech. rep., p2m berlin GmbH, Berlin, Germany, 2014. a
Ingerle, K.: Über Die Flussbettdurchlässigkeit Und Die Sauerstoffzehrung Des Uferfiltrats Im Staubereich von Donaukraftwerken, Wasserwirtschaft, 81, 415–422, 1991. a
Jarmersted, C.: Hydraulische Und Hydrochemische Aspekte Der Uferfiltration an Der Unterhavel in Berlin, vol. 140 of Berliner geowissenschaftliche Abhandlungen, Selbstverlag Fachbereich Geowissenschaften, FU Berlin, Berlin, Germany, 1992. a, b, c
Karpf, C.: Modellierung Der Interaktion Zwischen Grundwasser Und Kanalisation, PhD thesis, TU Dresden, Germany, 2012. a
Liese, M., Heinzmann, B., Berlin, K. W., and Wasserbetriebe, B., (Eds.): 12 Jahre Pilotbetrieb Karolinenhöhe: zusammenfassende Auswertung, no. 8 in Schriftenreihe Kompetenzzentrum Wasser Berlin, Kompetenzzentrum Wasser, Berlin, Germany, 2007. a
Limberg, A. and Thierbach, J.: Gliederung Der Grundwasserleiter in Berlin, Brandenburgische Geowiss. Beitr., 4, 21–26, 1997. a, b
Limberg, A. and Thierbach, J.: Hydrostratigrafie von Berlin-Korrelation Mit Dem Norddeutschen Gliederungsschema, Brandenburgische Geowiss. Beitr., 9, p. 2, 2002. a, b, c
Möller, K. and Burgschweiger, J.: Wasserversorgungskonzept Für Berlin Und Für Das von Den BWB Versorgte Umland (Entwicklung Bis 2040), Tech. rep., Berliner Wasserbetriebe, Berlin, Germany, 2008. a, b
Noack, V., Cherubini, Y., Scheck-Wenderoth, M., Lewerenz, B., Höding, T., Simon, A., and Moeck, I.: Assessment of the Present-Day Thermal Field (NE German Basin) – Inferences from 3-D Modelling, Chem. Erde-Geochem., 70, 47–62, 2010. a
Norden, B.: Modelling of the Near-Surface Groundwater Flow System at the CO2SINK Site Ketzin, Germany, Z. Dtsch. Ges. Geowiss., 162, 63–77, 2011. a
Norden, B. and Förster, A.: Thermal Conductivity and Radiogenic Heat Production of Sedimentary and Magmatic Rocks in the Northeast German Basin, AAPG Bull., 90, 939–962, 2006. a
Norden, B., Förster, A., Behrends, K., Krause, K., Stecken, L., and Meyer, R.: Geological 3-D Model of the Larger Altensalzwedel Area, Germany, for Temperature Prognosis and Reservoir Simulation, Environ. Earth. Sci., 67, 511–526, https://doi.org/10.1007/s12665-012-1709-9, 2012. a
Otto, R.: Zur Abschätzung von Wärmeleitfähigkeiten Der Oberflächennahen Lockergesteinsschichtenfolge in Norddeutschland, Grundwasser, 17, 219–229, https://doi.org/10.1007/s00767-012-0205-1, 2012. a
Schälchli, U.: Die Kolmation von Fliessgewässersohlen: Prozesse Und Berechnungsgrundlagen, Tech. rep., Technische Hochschule Zürich, Zürich, Switzerland, 1993. a
Senate Department for Urban Development and Housing: Map: 04.02 Long-Term Mean Air Temperatures 1961–1990 (Edn. 2001), in: Environmental Atlas, Senate Department for Urban Development and Housing, Berlin, Germany, 2001. a
Sippel, J., Fuchs, S., Cacace, M., Kastner, O., Huenges, E., and Scheck-Wenderoth, M.: Deep 3-D Thermal Modelling for the City of Berlin (Germany), Environ. Earth. Sci., 70, 3545–3566, https://doi.org/10.1007/s12665-013-2679-2, 2013. a, b
Squillacote, A. H., Ahrens, J., Law, C., Geveci, B., Moreland, K., and King, B.: The Paraview Guide, vol. 366, Kitware, Clifton Park, NY, USA, 2007. a
VDI: Thermische Nutzung Des Untergrundes: Grundlagen, Genehmigungen, Umweltaspekte, VDI 4640, Verein Deutscher Ingenieure e.V., Düsseldorf, Germany, 2010. a