 | 10 Aug 2018
Methane and ethane emission scenarios for potential shale gas production in Europe
Antoon J. H. Visschedijk
Hugo A. C. Denier van der Gon
Hans C. Doornenbal
Lorenzo Cremonese
A main concern surrounding (shale) gas production and exploitation is the leakage of methane, a potent greenhouse gas. High leakage rates have been observed outside of Europe but the representativeness of these observations for Europe is unknown. To facilitate the monitoring of methane leakage from a future shale gas industry in Europe we developed potential production scenarios for ten major shale gas plays and identified a suitable tracer in (shale) gas to distinguish oil and gas related emissions from other methane sources. To distinguish gas leakage from other methane sources we propose ethane, a known tracer for leakage from oil and gas production but absent in emissions from other important methane sources in Europe. Ethane contents for the ten plays are estimated from a European gas composition database and shale gas composition and reservoir data from the US, resulting in three different classes of ethane to methane ratios in the raw gas (0.015, 0.04 and 0.1). The ethane content classes have a relation with the average thermal maturity, a basic shale gas reservoir characteristic, which is known for all ten European shale gas plays. By assuming different production scenarios in addition to a range of possible gas leakage rates, we estimate potential ethane tracer release by shale gas play. Ethane emissions are estimated by play following a low, medium or high gas production scenario in combination with leakage rates ranging from 0.2 %–10 % based on observed leakage rates in the US.


Power generation using natural gas or shale gas is less carbon-intensive than coal by approximately half (IPCC, 2011). Therefore, conventional gas and/or shale gas could be an important transition fuel to future low carbon sustainable energy systems. However, one of the main concerns surrounding (shale) gas production and exploitation is the leakage of methane (CH4), a potent greenhouse gas with a global warming potential of 28 (IPCC, 2013). Literature suggests that with leakage rates ≥3 % of the gas production, the advantage of gas over coal in electricity production may be lost (Alvarez et al., 2012).
Table 1Most promising shale gas plays in Europe based on US EIA (Kuuskraa et al., 2013) and TNO data, recoverable reserve (dry or wet gas), average thermal maturity (Ro), estimated C2∕C1 ratio and range of C2H6 leakage rates following different shale gas production scenarios.
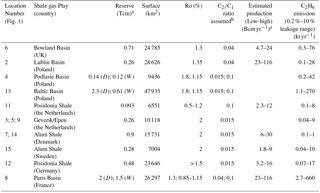
a Reserves (risked recoverable resource) in Trillion Cubic Meters (Tcm); Estimated production in Billion Cubic Meters (Bcm); When available, reserves are given for dry gas (D) and wet gas (W) separately; b See text Sect. 4.1.
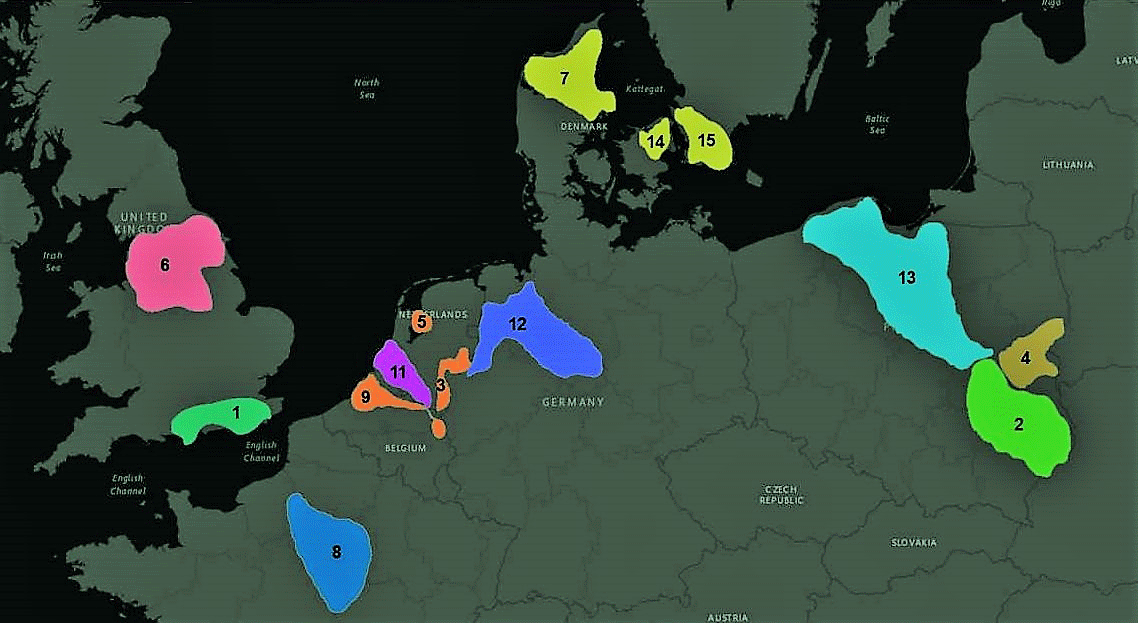
Figure 1The location of the selected shale gas plays (see also Table 1). Note that play number 1 (Weald Basin) shown here is not further used as it contains mostly shale oil and only little shale gas.
Future shale gas production in Europe will occur in a complex landscape with many different sources of methane present such as animal husbandry and/or wetlands. This complicates the identification of methane leakage during (shale) gas production. In addition, methane has a lifetime of about 10 years, which results in a high background concentration that easily obscures any local source contribution. These problems can be overcome by using unique tracers such as isotopes or co-emitted (hydrocarbon) species (see e.g. Petron et al., 2012; Roscioli et al., 2015; Yacovitch et al., 2017). Isotopic analysis is however expensive and complicated. Currently the most widely used tracer for shale gas and natural gas emissions is the co-emitted hydrocarbon ethane (C2H6) sometimes in combination with propane (Schwietzke et al., 2014; Roscioli et al., 2015; Dalsøren et al., 2018). If concentrations of these species are measured simultaneously, the information on the co-emitted ethane can be used as a marker to differentiate between biogenic and thermogenic methane and quantify the source strength of gas leakage. In this paper we investigate the potential ethane release for various shale gas production scenarios in Europe as an indicator of gas leakage losses.
Based on estimated reserves by US-EIA (Kuuskraa et al., 2013) and Zijp (2015) ten major shale gas plays are identified in seven EU Member States (Table 1). These plays are considered the most promising and form the basis for the proposed production scenarios. Current best estimates of the risked (risk-adjusted) technically recoverable resources are used to assess the potential amount of gas that can be produced. Maps of geologic formations and thermal maturity and US-EIA data (Kuuskraa et al., 2013) are consulted to estimate the location, area and extent of the plays, as well as their average thermal maturities (which has important implications for the raw gas composition).
A number of assumptions are made with regard to the pace at which a shale gas industry will mature and subsequently how long Europe's shale gas reserves will last. We assume a relatively fast development into a sizable industry with sustained production over a longer period of time, assuming no further obstacles e.g. with regard to social acceptance of shale gas production. A number of considerations and storylines are tested with regard to how long reserves would last, resulting in different predictions of potential sustained production:
-
For the Netherlands and the UK (two major gas consumers and producers), estimated national shale gas reserves could cover their own demand for about 10 years. However, to guarantee a sufficient return on investment a sustained production for the technical lifetime of infrastructures (20–30 years) would be more likely.
-
Phase-out of coal-based electricity could reduce CO2 emissions from the EU. The projected coal-based electricity generating capacity in 2030 according to the EU Reference Scenario (EC, 2016) could be covered by shale gas production for 70 years.
-
We estimated that in the current economic climate an annual drilling rate around between 200 and 350 wells would be the most likely for the UK and Germany, resulting in the combined reserves for these two countries to last 100–150 years.
The above considerations and variation in production times lead us to propose three possible shale gas production rates based on three estimated intervals during which reserves would be exhausted; low, medium and high production rates during which reserves are exhausted in 150, 70 and 30 years, respectively. Table 1 shows the resulting projected annual production per shale gas play, assuming all plays to be exploited concurrently, at a constant rate in the indicated time slot.
Atmospheric measurements of methane and ethane over a large production area can be used to make top-down assessments of overall methane leakage. The overall methane source strength can be expressed as a loss fraction (leakage rate) of total production within the domain of study (Alvarez et al., 2018). Peischl et al. (2015) compiled such top-down estimates of methane leak rates using airplane flights with air masses sampling over three of the largest shale gas plays in the US and quantified the net methane emissions using a mass balance method. Methane leakages of 0.25 % up to ∼9 % of total production have been observed (Peischl et al., 2015). The shale gas plays studied accounted for over 50 % of the US shale gas production in 2013 and hence provide a representative range. Since the top-down method provides an integrated estimate, it is not fully understood why the loss rates vary so much between plays but contribution and behaviour of super-emitters is currently under investigation (Zavala-Araiza et al., 2017). Regardless of the representativeness for Europe, it can be concluded that with a leakage range of 0.2 %–10 % all possible scenarios based on available US data are covered, taking note of the fact that 10 % would be considered an extreme worst case scenario.
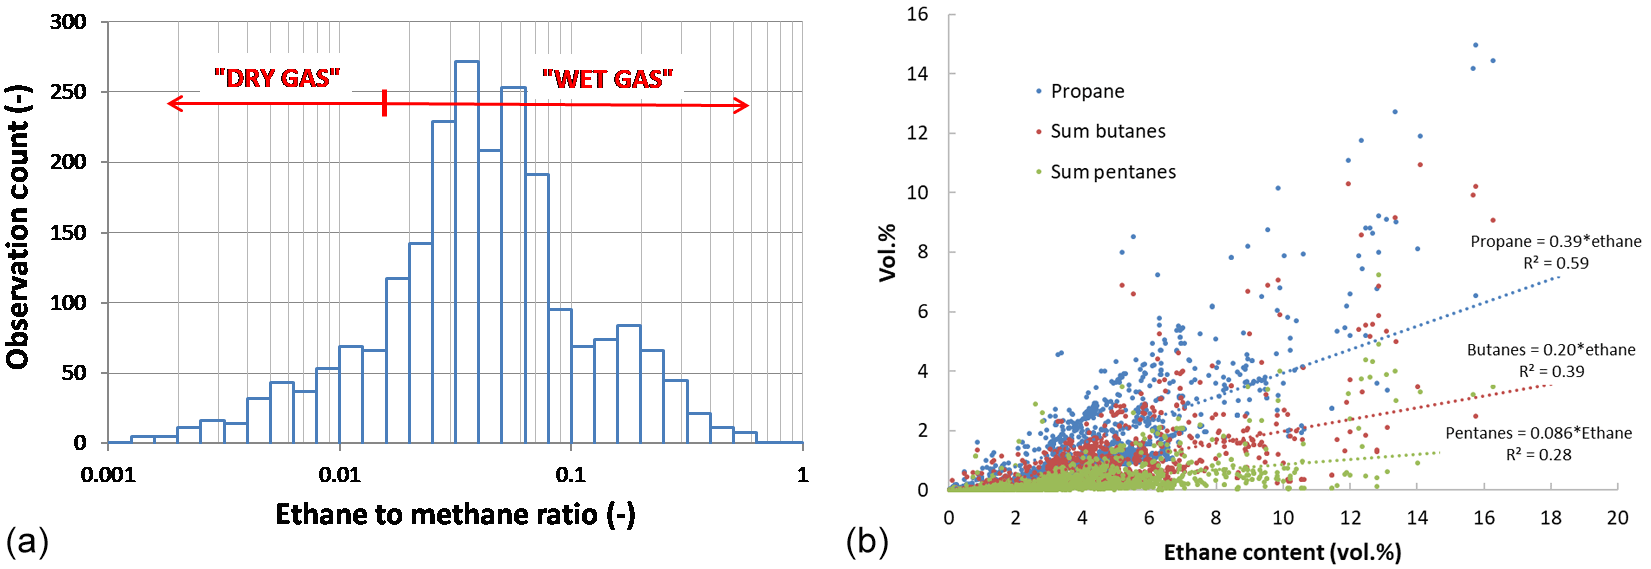
Figure 2(a) Histogram of the ethane to methane ratio (C2∕C1) as found in Europe in conventionally produced natural gas (left) and (b) fraction of higher alkanes as function of the ethane content (right) based on the raw gas composition database compiled by Doornenbal (2010).
3.1 Estimates for shale gas based on raw gas composition
An extensive database of raw (well head) natural gas composition data is compiled from publicly available data and from existing (partly confidential) databases by TNO (Doornenbal, 2010). The focus is primarily on conventional on-shore natural gas production but for the UK, the Netherlands and Denmark off-shore gas production is included as well. Doornenbal (2010) collected over 2000 records of measured raw gas composition data for the range C1 to C5. The best represented countries are the Netherlands, Germany and Poland, followed by Denmark and UK with considerable coverage, and limited data for France, Italy and Romania. The frequency distribution of the observed ethane to methane molar ratio (C2∕C1) is shown in Fig. 2a. The median value of this ratio (0.038) corresponds to an ethane volume percentage of ∼3.2 %. The observed ethane to methane ratios are apparently lognormally distributed over a three decade range (0.001–1) with about 70 % percent of the observation being between 0.01 and 0.1. Figure 2b plots the ethane content as recorded in the raw gas composition database against the content of propane, butanes and pentanes, with which positive correlations are observed. Based on these relations, the content of C3 to C5 alkanes may be estimated from the ethane content. Hydrocarbons in the C2 to C5 range are dominated by ethane that occurs in amounts between two and three times the amount of propane and making up about half of the total amount of C2 to C5 alkanes. Atmospheric measurements of these higher alkanes next to ethane could be used as an additional fingerprint (e.g. Petron et al., 2012; Dalsøren et al., 2018) but this is not further discussed here.
3.2 Other sources of ethane in Europe
Ethane emission in 2011 from other sources in the EU can be derived from the TNO-MACC_III non-methane volatile organic carbon (NMVOC) emission inventory, using a source sector specific NMVOC speciation profile (Kuenen et al., 2014). The inventory includes leakage of ethane during production, transmission and distribution of conventional natural gas. Ethane represents about half of the total NMVOC from this source sector, in line with the composition as shown in Fig. 2b. Ethane is also released by high and low pressure venting during and following the production of crude oil, with an assumed overall ethane to NMVOC ratio of 6 % (USEPA, 1988). In 2011, oil and gas production was responsible for a total ethane emission of 80 kt in the EU. Ethane is furthermore an important component of NMVOC released from combustion processes such as household combustion, as well as the open burning, of wood and other herbaceous matter. The ethane content from this source is assumed to be 5.8 % of total NMVOC (Veldt and Berdowski, 1995) resulting in a total release of about 120 kt. Industry (e.g. petrochemical industry and petroleum refining) is a moderate ethane source, accounting for about 70 kt. Some ethane is also released from gasoline-fuelled mobile sources, with an ethane to NMVOC ratio of 1 % to 2 %, resulting in a release of 24 kt. Total ethane emission in the EU in 2011 is estimated at about 290 kt.
4.1 Prediction of ethane content in European shale gas
Ethane is proposed as a useful tracer for gas leakage in Europe as it is nearly always present as a significant component of the higher hydrocarbons (C2+, Fig. 2b) in raw natural gas. Depending on the gas field, its molar fraction can however vary widely (Fig. 2a) and this degree of variation cannot be adequately characterized by an overall average only. Therefore, a way to approximate ethane concentrations in raw shale gas based on reservoir characteristics was sought. Thermal maturity of the reservoir, which is a known and fairly basic shale gas reservoir characteristic, is found to be the most practical predictive proxy. Thermal maturity is an indicator of the thermal history of a reservoir rock, and it is assessed by vitrinite reflectance of the organic fraction of the rock (kerogen). The generation of new hydrocarbon species during the geological history of the reservoir is controlled by the temperature (generally the maximum temperature, Tmax) that this material has experienced. Since shale gas has never migrated out of its source rock (contrary to conventional gas) there is a direct relation between the gas composition and the thermal maturity of the reservoir. Thermal maturity can therefore be used to predict whether a shale gas play contains “dry gas” or “wet gas”, unless the shale gas has a biogenic instead of thermogenic origin. Gas “wetness” is defined here as (ΣC2 to C5) ∕ (ΣC1 to C5). If this ratio is below 0.03 the gas would be considered dry and for a wetness above 0.03 the gas is considered wet (Tissot and Welte, 1984).
The main phase for oil and wet gas generation usually occurs in the range 0.65 %–1.3 % Ro (Kuuskraa et al., 2013). This range is also adopted by Kuuskraa et al. (2013). Dry gas is instead generally generated by rocks with an Ro ≥1.3 % (Kuuskraa et al., 2013). Since the transition from an oil- to pure methane-bearing source is gradual, source rock with Ro ∼1.3 % belongs to the “transition zone”, where the characteristics of ”wet” and “dry” overlap. Kuuskraa et al. (2013) regard a Ro ∼1.3 % to be the start of the dry gas zone while Killops and Killops (2005) regard a Ro ∼1.3 % to be firmly in the wet gas region, illustrating that there is no universally accepted classification. The more Ro moves further from the “wet” to the “dry” region, the lower will be the content of C2-C5 hydrocarbons, until above an Ro of 3.5 % all higher hydrocarbons are destroyed. Both Berner (1989) and Whiticar (1994) relate the relative amounts of ethane in natural gas to the thermal maturity of the source rock. Their observations applied, however, only to a limited number of conventional gas fields and may be too specific to directly apply to European shale gas reservoirs in general.
For the shale gas plays under consideration in this study average overall Ro values are found to be (1) across the boundary between dry and wet gas with Ro around 1.3 % (Bowland and Lublin Basins and a large part of the Paris Basin); (2) below the transition of wet/dry gas with a Ro < 1.3 % (Polish Baltic and Podlasie Basins, French Paris Basin and Dutch Posidonia Shale); or (3) fully in the dry gas window with Ro being firmly above 1.3 % (largest parts of the Baltic and Podlasie Basins and the entire Alum Shale, the German Posidonia and Dutch Geverik). Because there is almost no data available on compositions of raw shale gas in Europe, a parallel is drawn to conventional natural gas. Furthermore, given the high uncertainty involved when using the average source rock Ro to predict average ethane content, only three indicative ethane to methane ratios are proposed and assigned to the shale gas plays for the range of Ro values observed (Table 1). The ratios are defined for wet gas, for the wet/dry transition region (representing the majority of the observed ethane to methane ratios in natural gas), and for primarily dry gas. The C2∕C1 (ethane to methane) ratios associated to these three gas composition groups are 0.1, 0.04 and 0.015, respectively. Should shale gas really be produced it will be easy to measure the average actual ethane content and the derived values proposed here should be replaced.
Bullin and Krouskop (2009) report shale gas composition data for several major shale gas plays in the US, together with qualitative geographical data on gas where sampling took place. Combining the indicative well locations with maturity maps of North American shale gas plays and comparing the reported ethane with derived Ro data roughly confirms our assumed ethane contents for the European shale gas plays (data not shown). The assumed ethane contents also agree quite well with the data by Berner (1989) and Whiticar (1994).
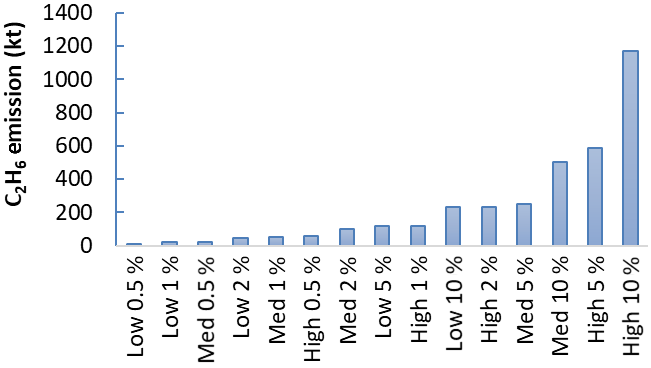
Figure 3Ethane emissions from all European shale gas plays considered under varying production and leakage scenarios; Low, Med and High indicate low, medium and high production scenarios. The percentages indicate the assumed upstream leakage of gas.
4.2 Calculated releases following the production scenarios
Total annual release of the tracer ethane from potential shale gas production in the EU can be estimated by combining annual shale gas production rates (High, Medium and Low production scenarios) with leakage rates between 0.2 % to 10 % and the estimated ethane content in each play, varying between 0.1, 0.4 and 0.015 C2∕C1, depending on thermal maturity. The range in C2∕C1 ratios accounts for the variability in ethane to methane ratios in (shale) gas. However, as seen in Fig. 2a, even within one play or one class of thermal maturity (e.g., dry gas) there will be variation in ethane content. This variation is currently not accounted for and it is strongly advised to use real measurement data by shale gas play once such data become available. The resulting total annual ethane emissions, varying from 5 to 1200 kt, for sixteen scenario-leakage rate combinations, in ascending order, are shown in Fig. 3. There is clearly overlap between scenarios. For example the Medium, Low and High production scenario with respectively 2 %, 5 % and 1 % leakage rates result in approximately the same total emission (Fig. 3). On average low leakage rates (< 0.5 %) result in emission below 60 kt yr−1, medium leakage (between 0.5 and 2 %) in emission in the order of 25 and 240 kt yr−1 and high leakage (> 2%) in emission of about 100 to 600 kt yr−1, and up to 1200 kt yr−1 in case of extremely high leakage (10 %) in combination with the High production scenario. In Sect. 3.2 existing ethane sources in Europe are estimated to emit 290 kt yr−1. Based on the various derived ethane to methane ratios, European ethane emission between 5 and 1200 kt yr−1 would be accompanied by methane releases ranging between 100 kt yr−1 to 25 Mt yr−1. For comparison, the total EU methane emission in 2015 was about 18 Mt. Hence the “High production with high leakage” scenario would cause a dramatic change of the European methane budget.
To facilitate the monitoring and mitigation of methane leakage from a future shale gas industry in Europe we developed potential production scenarios and propose ethane as a suitable tracer in (shale) gas to distinguish oil and gas related emissions from other methane sources. Using the data from a raw natural gas composition database (Doornenbal, 2010) and the relation of gas composition with thermal maturity, we estimated the expected ethane content by play. By combining the leakage range of 0.2 % all the way up to the extreme case of 10 %, the feasible shale gas production in Europe and the predicted ethane content by shale gas play, a data set of potential methane and ethane emissions is prepared. The projected shale gas leakage range for the tracer ethane is compared to the estimated current ethane emissions from other sources in Europe. Especially for high leakage rates, shale gas-related emissions would easily dominate the European ethane emissions. Starting from the Medium production scenario, shale gas leakage would be significantly influencing total ethane emission from 2 % leakage and up (about 100 kt yr−1 ethane emission) and would start to dominate emissions at 5% leakage (∼300 kt yr−1 ethane). The 2 % leakage is close to the recently published 2.3% leakage of gross US gas production based on 30+ studies accounting for ∼30 % of US gas production (Alvarez et al., 2018). The spatially distributed emissions data can be used as input for an atmospheric chemistry and transport model to predict possible changes in methane and ethane concentrations in the atmosphere following the various scenarios. As a follow-up of the work presented here we aim to investigate if the existing monitoring capacity for atmospheric composition in Europe can be used to detect significant leakages from a potential future shale gas industry in Europe. Such a system could function as an early warning system and assure that (shale) gas production is performed as climate friendly as possible, i.e. ensuring lowest possible methane emissions to the atmosphere.
There are no data to download for this paper. This is (a) because we develop scenarios and all the derived estimates are shown in Table 1 and the figures. (b) Because the gas composition data as shown in Fig. 2b come from a geologial atlas which is sold as a product and cannot be made available freely: The Southern Permian Basin Atlas (SPBA) project is a joint project of the Geological Surveys of the United Kingdom, Belgium, Denmark, the Netherlands, Germany and Poland and was initiated by Ken Glennie. The atlas was published in May 2010 in both paper and digital format. It can be ordered at https://www.tno.nl/en/focus-areas/energy/roadmaps/geological-survey-of-the-netherlands/geological-survey-of-the-netherlands/petroleum-geological-atlas-of-the-southern-permian-basin/.
In a follow-up paper we will spatially distribute the emissions Fig. 3 over Europe make the grid available but this was not yet done in the present paper.
The authors declare that they have no conflict of interest.
This article is part of the special issue “European Geosciences Union General Assembly 2018, EGU Division Energy, Resources & Environment (ERE)”. It is a result of the EGU General Assembly 2018, Vienna, Austria, 8–13 April 2018.
We thank especially one the anonymous reviewers for his/her careful reading
of our manuscript and valuable comments leading to significant improvement.
This research is partly funded by the European Union's Horizon 2020
programme under grant agreement number 640715.
Edited by: Michael Kühn
Reviewed by: two anonymous referees
Alvarez, R. A., Pacala, S. W., Winebrake, J. J., Chameides, W. L., and Hamburg, S. P.: Methane leakage from natural gas infrastructure, P. Natl. Acad. Sci. USA, 109, 6435–6440, https://doi.org/10.1073/pnas.1202407109, 2012.
Alvarez, R. A., Zavala-Araiza, D., Lyon, D. R., Allen, D. T., Barkley, Z. R., Brandt, A. R., Davis, K. J., Herndon, S. C., Jacob, D. J., Karion, A., Kort, E. A., Lamb, B. K., Lauvaux, T., Maasakkers, J. D., Marchese, A. J., Omara, M., Pacala, S. W., Peischl, J., Robinson, A. L., Shepson, P. B., Sweeney, C., Townsend-Small, A., Wofsy, S. C., and Hamburg, S. P.: Assessment of methane emissions from the US oil and gas supply chain, Science, eaar7204, https://doi.org/10.1126/science.aar7204, 2018.
Berner, U.: Entwicklung und Anwendung empirischer Modelle für die Isotopenvariationen in Mischungen thermogener Erdgase (PhD thesis), Technische Univ. Clausthal, Clausthal, Germany, 1989.
Bullin, K. A. and Krouskop, P. E.: Compositional variety complicates processing plans for US shale gas, Oil Gas J., 107, 50–55, 2009.
Dalsøren, S. B., Myhre, G., Hodnebrog, Ø., Lund Myhre, C., Stohl, A., Pisso, I., Schwietzke, S., Höglund-Isaksson, L., Helmig, D., Reimann, S., Sauvage, S., Schmidbauer, N., Read, K. A., Carpenter, L. J., Lewis, A. C., Punjabi, S., and Wallaschm M.: Discrepancy between simulated and observed ethane and propane levels explained by underestimated fossil emissions, Nat. Geosci., 11, 178–184, https://doi.org/10.1038/s41561-018-0073-0, 2018.
Doornenbal, J. C.: SPBA GIS Maps and Database – Petroleum Geological Atlas of the Southern Permian Basin Area, TNO-Geological Survey of the Netherlands, ISBN 978-90-5986-349-1, 2010.
EC (European Commission): EU Reference Scenario 2016, Energy, transport and GHG emissions Trends to 2050, ISBN 978-92-79-52374-8, https://doi.org/10.2833/001137, MJ-01-15-793-EN-N, 2016.
IPCC: IPCC Special Report on Renewable Energy Sources and Climate Change Mitigation, Prepared by Working Group III of the Intergovernmental Panel on Climate Change, 1075, 2011.
IPCC: Climate Change 2013: The Physical Science Basis. Contribution of Working Group I to the Fifth Assessment Report of the Intergovernmental Panel on Climate Change, edited by: Stocker, T. F., Qin, D., Plattner, G.-K., Tignor, M., Allen, S. K., Boschung, J., Nauels, A., Xia, Y., Bexm V. and Midgley, P. M., Cambridge University Press, Cambridge, UKand New York, NY, USA, 1535 pp., https://doi.org/10.1017/CBO9781107415324, 2013.
Killops, S. D. and Killops, V. J.: Introduction to organic chemistry, 2nd edition, Blackwell Publishing, Hoboken, NJ, USA, 2005.
Kuenen, J. J. P., Visschedijk, A. J. H., Jozwicka, M., and Denier van der Gon, H. A. C.: TNO-MACC_II emission inventory; a multi-year (2003–2009) consistent high-resolution European emission inventory for air quality modelling, Atmos. Chem. Phys., 14, 10963–10976, https://doi.org/10.5194/acp-14-10963-2014, 2014.
Kuuskraa, V., Stevens, S. H., and Moodhe, K. D.: Technically recoverable shale oil and shale gas resources: an assessment of 137 shale formations in 41 countries outside the United States, US Energy Information Administration, US Department of Energy, Washington DC, USA, 2013.
Peischl, J., Ryerson, T. B., Aikin, K. C., De Gouw, J. A., Gilman, J. B., Holloway, J. S., Lerner, B. M., Nadkarni, R., Neuman, J. A., Nowak, J. B., Trainer, M., Warneke, C., and Parrish, D. D.: Quantifying atmospheric methane emissions from the Haynesville, Fayetteville, and north-eastern Marcellus shale gas production regions, J. Geophys. Res.-Atmos. 120, 2119–2139, 2015.
Pétron, G., Frost, G., Miller, B. R., Hirsch, A. I., Montzka, S. A., Karion, A., Trainer, M., Sweeney, C., Andrews, A. E., Miller, L., Kofler, J., Bar-Ilan, A., Dlugokencky, E. J., Patrick, L., Moore, C. T., Ryerson, T. B., Siso, C., Kolodzey, W., Lang, P. M., Conway, T., Novelli, P., Masarie, K., Hall, B., Guenther, D., Kitzis, D., Miller, J., Welsh, D., Wolfe, D., Neff, W., and Tans, P. : Hydrocarbon emissions characterization in the Colorado Front Range: A pilot study, J. Geophys. Res.-Atmos., 117, D04304, https://doi.org/10.1029/2011JD016360, 2012.
Roscioli, J. R., Yacovitch, T. I., Floerchinger, C., Mitchell, A. L., Tkacik, D. S., Subramanian, R., Martinez, D. M., Vaughn, T. L., Williams, L., Zimmerle, D., Robinson, A. L., Herndon, S. C., and Marchese, A. J.: Measurements of methane emissions from natural gas gathering facilities and processing plants: measurement methods, Atmos. Meas. Tech., 8, 2017–2035, https://doi.org/10.5194/amt-8-2017-2015, 2015.
Schwietzke, S., Griffin, W. M., Matthews, H. S., and Bruhwiler, L. M.: Natural gas fugitive emissions rates constrained by global atmospheric methane and ethane, Environ. Sci. Technol., 48, 7714–7722, 2014.
Tissot, B. P. and Welte, D. H.: Petroleum formation and occurrence, Springer-Verlag, Berlin, Germany, p. 200, 1984.
USEPA: Air Emissions Speciation Manual, Vol. 1. Volatile Organic Compound Speciation Profiles, United States Environmental Protection Agency, EPA-450/2-88-003a, 1988.
Veldt, C. and Berdowski, J. J. M.: GEIA-Note on the combustion of biomass fuels (Emission factors for CO, CH4 and NMVOC), TNO-MW, Delft, the Netherlands, TNO Report TNO-MW-R94/218, 1995.
Whiticar, M. J.: Correlation of natural gases with their sources, AAPG Bull., 60, 261–283, 1994.
Yacovitch, T. I., Daube, C., Vaughn, T. L., Bell, C. S., Roscioli, J. R., Berk Knighton, W., Nelson, D. D., Zimmerle, D., Pétron, G., and Herndon S. C.: Natural gas facility methane emissions: Measurements by tracer flux ratio in two US natural gas producing basins, Elem. Sci. Anth., 5, 69, https://doi.org/10.1525/elementa.251, 2017.
Zavala-Araiza, D., Alvarez, R. A., Lyon, D. R., Allen, D. T., Marchese, A. J., Zimmerle, D. J., and Hamburg, S. P.: Super-emitters in natural gas infrastructure are caused by abnormal process conditions, Nat. Commun., 8, 14012, https://doi.org/10.1038/ncomms14012, 2017.
Zijp, M. H. A. A., Nelskamp, S., Verreussel, R., and ter Heege, J.: The Geverik Member of the Carboniferous Epen Formation, Shale Gas Potential in Western Europe, IPTC-18410-MS, 2015.